2.9.1
異常検知①
まとめ
- ADTKの基本検出器(閾値・統計ベース)を使い、時系列の異常をルールベースで検出する。
rn- 特徴量設計と検出器選択の組み合わせで、誤検知と見逃しのバランスを調整する。rn- 検知結果の可視化により、異常判定の妥当性を運用目線で確認できる。
直感 #
ADTKは「モデルを1つ学習して終わり」ではなく、時系列の特徴量変換と検出器を部品として組み合わせる発想です。対象データの周期性や変動幅に合わせて検出ロジックを構成することで、運用しやすい異常検知パイプラインを作れます。
詳細な解説 #
1. 実験データの準備 #
ここでは Numenta Anomaly Benchmark (NAB) のデータを使い、
ADTK (Anomaly Detection Toolkit) で異常検知を試します。
| |
| |
2. 代表的な異常検知手法 #
ADTKには様々な検出器が用意されています。ここでは代表的な5種類を比較します。
| |
3. 各手法の直感と数式 #
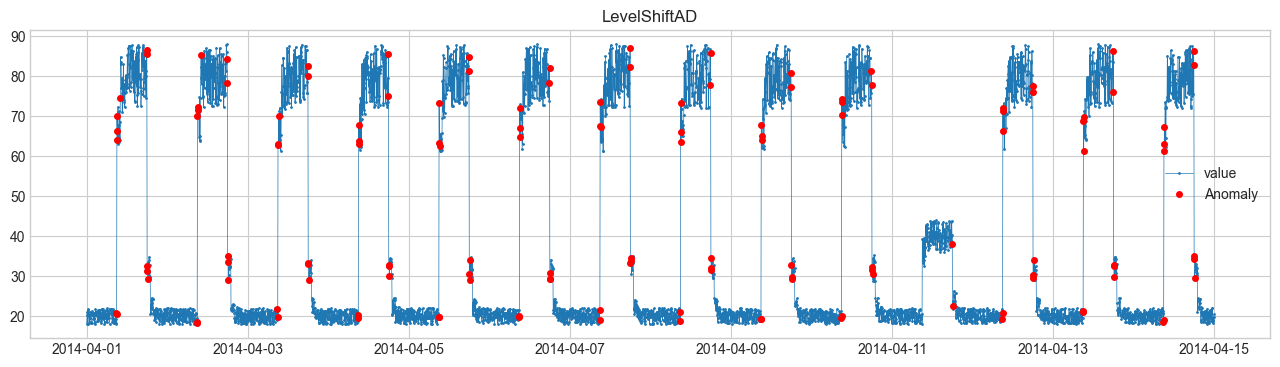
(1) LevelShiftAD(水準の変化) #
データの平均値が急に変化するかどうかを見る。
例:センサー値がある時点で急に上がった/下がった。
もし \(|\Delta_t|\) が大きければ異常と判定。
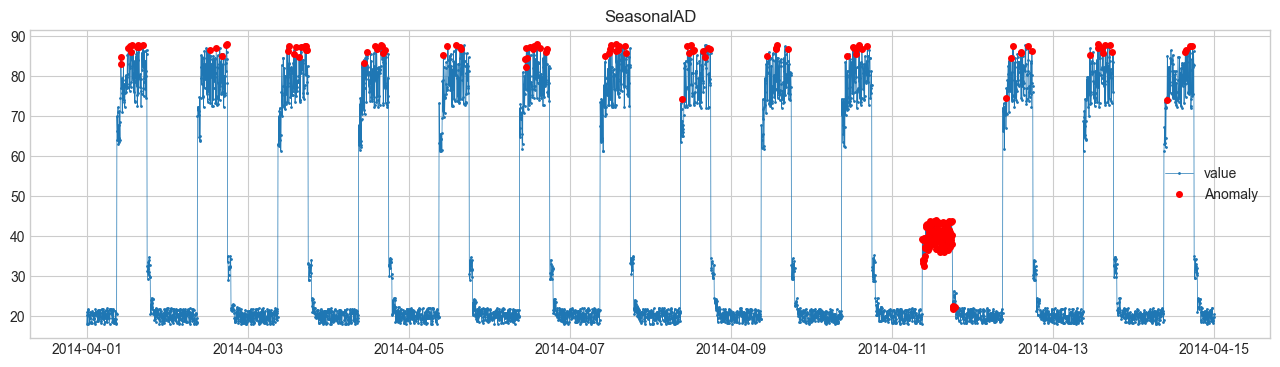
(2) SeasonalAD(季節性とのズレ) #
周期性を学習し、そのパターンから外れるデータを検知。
例:毎日のアクセス数が急に増えすぎた。
誤差 \(e_t\) が大きければ異常。
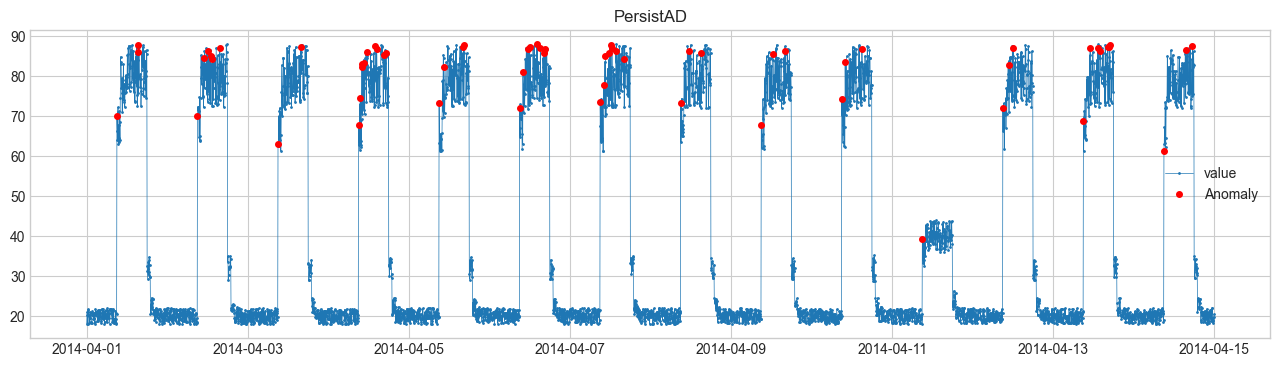
(3) PersistAD(値の持続) #
「過去の値から大きく乖離したか」を判定。
$$ |x_t - x_{t-1}| > c \cdot \sigma $$閾値 \(c\) を超えると異常。
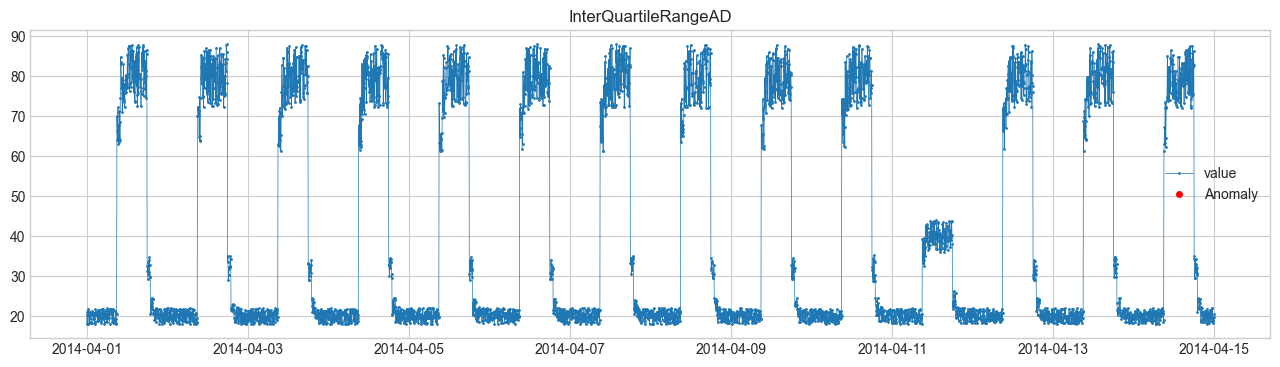
(4) InterQuartileRangeAD(四分位範囲) #
統計的に外れ値を検出。
データ分布の第1四分位 \(Q1\)、第3四分位 \(Q3\)、四分位範囲 \(IQR=Q3-Q1\) を用いる。
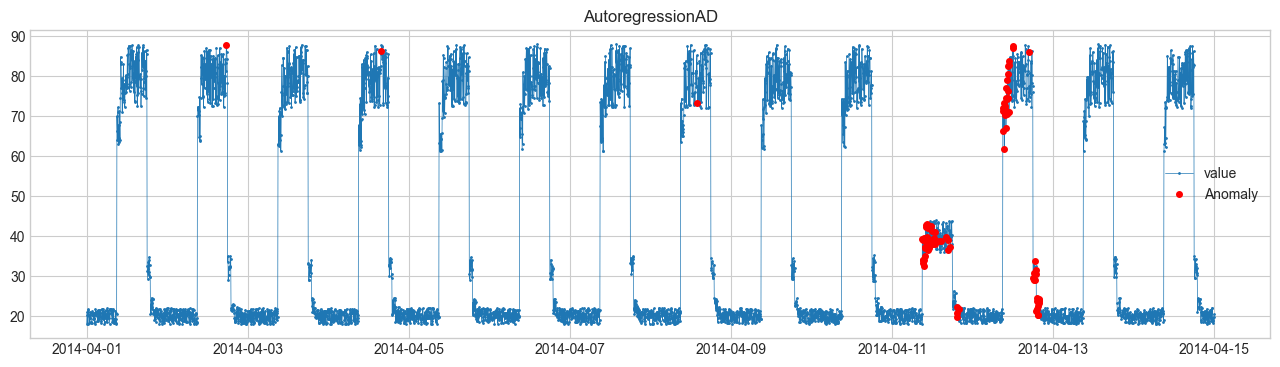
(5) AutoregressionAD(自己回帰) #
過去の値から未来を予測し、誤差が大きい点を異常とする。
$$ x_t \approx \sum_{i=1}^p \phi_i x_{t-i} + \epsilon_t $$残差 \(\epsilon_t\) が大きいと異常。
4. 可視化結果 #
- 異常検知② — 続編
- Isolation Forest — ツリーベースの異常検知
- One-Class SVM — SVMベースの異常検知手法