まとめ- LightGBMはMicrosoftが開発した勾配ブースティングライブラリで、ヒストグラム近似と葉優先(Leaf-wise)の木構築で大規模データを高速に処理する。
- カテゴリ変数のネイティブ処理、GPU学習、分散学習に対応し、前処理の手間を削減できる。
num_leaves・learning_rate・n_estimators・min_child_samplesが主なチューニング対象。
直感
#
通常の勾配ブースティングは木をレベルごとに均等に成長させるが、LightGBMは損失をもっとも減らせる葉を優先的に分割する(Leaf-wise)。これにより同じ木の数でも精度が出やすく、学習も速い。さらにヒストグラム近似で分割候補を大幅に減らすため、大規模データでも実用的な速度で動作する。
flowchart LR
A["学習データ"] --> B["ヒストグラム\n近似で離散化"]
B --> C["損失最大の\n葉を分割\n(Leaf-wise)"]
C --> D["学習率ηで\n予測に加算"]
D --> E{"収束?"}
E -->|No| C
E -->|Yes| F["最終予測"]
style A fill:#2563eb,color:#fff
style C fill:#1e40af,color:#fff
style F fill:#10b981,color:#fff
アルゴリズムの詳細
#
ヒストグラムベースの分割探索
#
従来の勾配ブースティングでは、すべてのサンプル×すべての特徴量で分割候補を評価するため、計算量は\(O(n \times d)\)です。LightGBMは連続値の特徴量を固定個数のビン(デフォルト255個)に離散化し、ビン単位で勾配統計量を集計します。
$$
\text{計算量}: O(n \times d) \longrightarrow O(B \times d')
$$ここで\(B\)はビン数(\(\ll n\))、\(d’\)はバンドル後の特徴量数(\(\le d\))です。さらに、親ノードと一方の子ノードのヒストグラムの差分からもう一方の子ノードのヒストグラムを求める「ヒストグラム差分トリック」により計算量を半減させます。
GOSS(Gradient-based One-Side Sampling)
#
大きな勾配を持つサンプルは情報量が大きく、小さな勾配のサンプルはすでによく学習されています。GOSSはこの性質を利用してサンプリングを行います。
- 全サンプルの勾配の絶対値でソートします
- 上位\(a \times 100\)%のサンプル(集合\(A\))をすべて保持します
- 残りの\((1-a) \times 100\)%からランダムに\(b \times 100\)%をサンプリングします(集合\(B\))
- \(B\)のサンプルに重み\(\frac{1-a}{b}\)を掛けてデータ分布を補正します
分割ゲインの近似式は以下のようになります。
$$
\tilde{V}_j(d) = \frac{1}{n}\left(\frac{\left(\sum_{x_i \in A_l} g_i + \frac{1-a}{b}\sum_{x_i \in B_l} g_i\right)^2}{n_l^j(d)} + \frac{\left(\sum_{x_i \in A_r} g_i + \frac{1-a}{b}\sum_{x_i \in B_r} g_i\right)^2}{n_r^j(d)}\right)
$$EFB(Exclusive Feature Bundling)
#
高次元でスパースなデータでは、多くの特徴量が互いに排他的(同時に非ゼロにならない)です。EFBはこれらの特徴量をバンドルにまとめて1つの特徴量として扱います。
- 特徴量間の非排他性をグラフの辺として表現します
- グラフ彩色問題に帰着させ、貪欲法で近似的にバンドルを求めます
- 同一バンドル内の特徴量はオフセットを加えて1つの特徴量に統合します
これにより特徴量数が\(d\)から\(d’\)(バンドル数)に削減され、ヒストグラム構築の計算量がさらに減少します。
Leaf-wise成長 vs Level-wise成長
#
| Level-wise | Leaf-wise |
|---|
| 成長方法 | 同じ深さのノードをすべて分割 | 損失改善が最大の葉のみ分割 |
| メリット | バランスの良い木構造 | 同じ葉数でより低い損失を達成 |
| リスク | 不要な分割が発生しやすい | 過学習しやすい |
| 制御 | max_depth | num_leaves(\(\le 2^{\text{max_depth}}\)) |
flowchart TD
A["学習データ\n(N × D)"] --> B["EFB: 排他的特徴量を\nバンドル化 D→D'"]
B --> C["ヒストグラム離散化\n(255 bins)"]
C --> D["GOSS: 勾配ベースの\nサンプリング N→N'"]
D --> E["Leaf-wise\n分割探索"]
E --> F["損失改善が\n最大の葉を分割"]
F --> G{"収束?"}
G -->|No| D
G -->|Yes| H["最終モデル"]
style A fill:#2563eb,color:#fff
style E fill:#1e40af,color:#fff
style H fill:#10b981,color:#fff
参考リンク
Ke, G., Meng, Q., Finley, T., Wang, T., Chen, W., Ma, W., Ye, Q., & Liu, T.-Y. (2017). LightGBM: A Highly Efficient Gradient Boosting Decision Tree. Advances in Neural Information Processing Systems (NeurIPS), 30.
詳細な解説
#
ライブラリと実験データ
#
1
2
3
4
5
6
| import numpy as np
import matplotlib.pyplot as plt
from sklearn.datasets import make_classification
from sklearn.model_selection import train_test_split
from sklearn.metrics import roc_auc_score
from lightgbm import LGBMClassifier
|
1
2
3
4
5
6
7
| X, y = make_classification(
n_samples=1000, n_features=20, n_informative=10,
n_redundant=5, random_state=42
)
X_train, X_test, y_train, y_test = train_test_split(
X, y, test_size=0.3, random_state=42
)
|
基本的な学習と評価
#
 1
 2
 3
 4
 5
 6
 7
 8
 9
10
| model = LGBMClassifier(
n_estimators=100,
num_leaves=31,
learning_rate=0.1,
random_state=42,
verbose=-1,
)
model.fit(X_train, y_train)
y_prob = model.predict_proba(X_test)[:, 1]
print(f"ROC-AUC: {roc_auc_score(y_test, y_prob):.4f}")
|
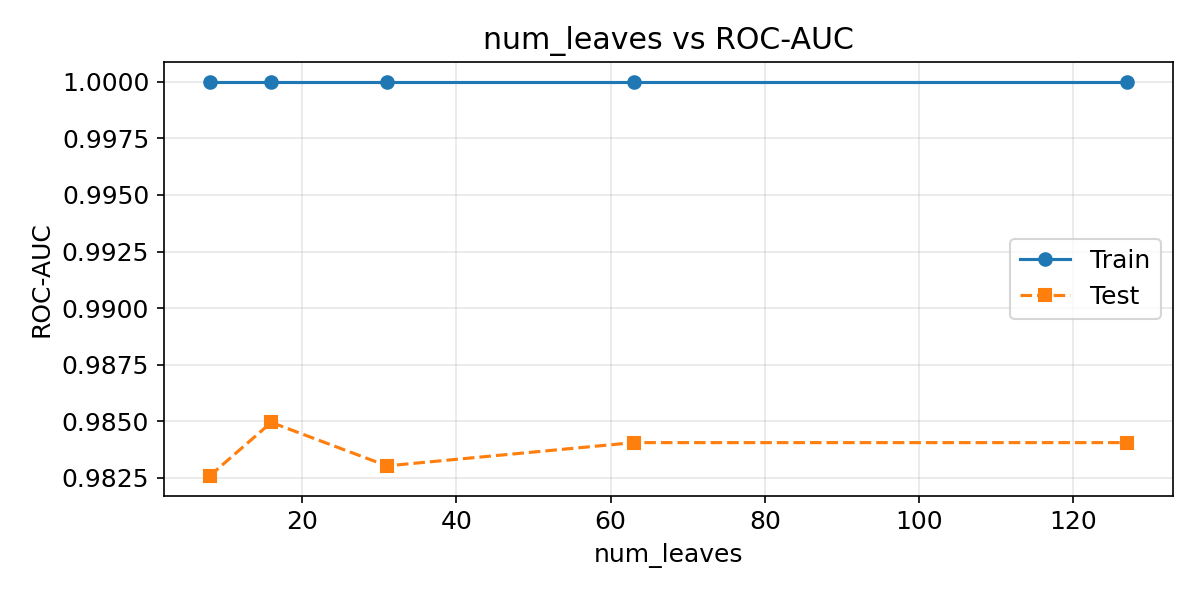
num_leavesの影響
#
num_leavesは木の最大葉数を制御します。大きくすると表現力が上がるが、過学習しやすくなります。max_depthよりも直接的にモデルの複雑さを決定するパラメーターです。
 1
 2
 3
 4
 5
 6
 7
 8
 9
10
11
12
13
14
15
16
17
18
19
20
| leaves_list = [8, 16, 31, 63, 127]
train_scores, test_scores = [], []
for nl in leaves_list:
m = LGBMClassifier(
n_estimators=100, num_leaves=nl,
learning_rate=0.1, random_state=42, verbose=-1,
)
m.fit(X_train, y_train)
train_scores.append(roc_auc_score(y_train, m.predict_proba(X_train)[:, 1]))
test_scores.append(roc_auc_score(y_test, m.predict_proba(X_test)[:, 1]))
plt.figure(figsize=(8, 4))
plt.plot(leaves_list, train_scores, "o-", label="Train")
plt.plot(leaves_list, test_scores, "s--", label="Test")
plt.xlabel("num_leaves")
plt.ylabel("ROC-AUC")
plt.title("num_leaves vs ROC-AUC")
plt.legend()
plt.grid(True, alpha=0.3)
plt.show()
|
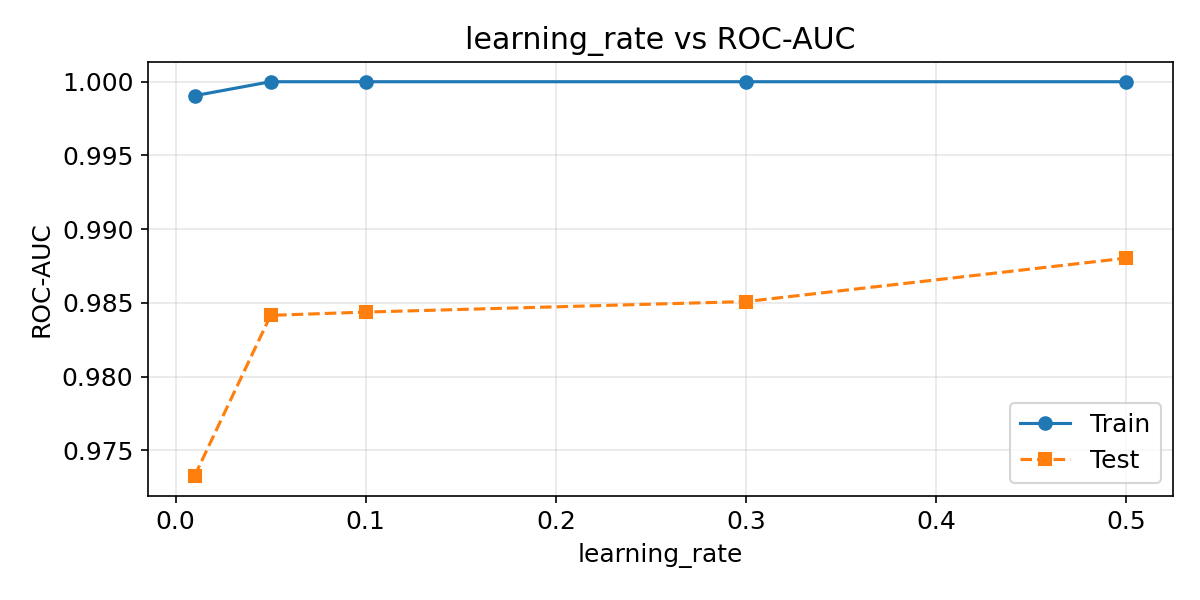
learning_rateの影響
#
 1
 2
 3
 4
 5
 6
 7
 8
 9
10
11
12
13
14
15
16
17
18
19
20
| rates = [0.01, 0.05, 0.1, 0.3, 0.5]
train_scores, test_scores = [], []
for lr in rates:
m = LGBMClassifier(
n_estimators=200, num_leaves=31,
learning_rate=lr, random_state=42, verbose=-1,
)
m.fit(X_train, y_train)
train_scores.append(roc_auc_score(y_train, m.predict_proba(X_train)[:, 1]))
test_scores.append(roc_auc_score(y_test, m.predict_proba(X_test)[:, 1]))
plt.figure(figsize=(8, 4))
plt.plot(rates, train_scores, "o-", label="Train")
plt.plot(rates, test_scores, "s--", label="Test")
plt.xlabel("learning_rate")
plt.ylabel("ROC-AUC")
plt.title("learning_rate vs ROC-AUC")
plt.legend()
plt.grid(True, alpha=0.3)
plt.show()
|
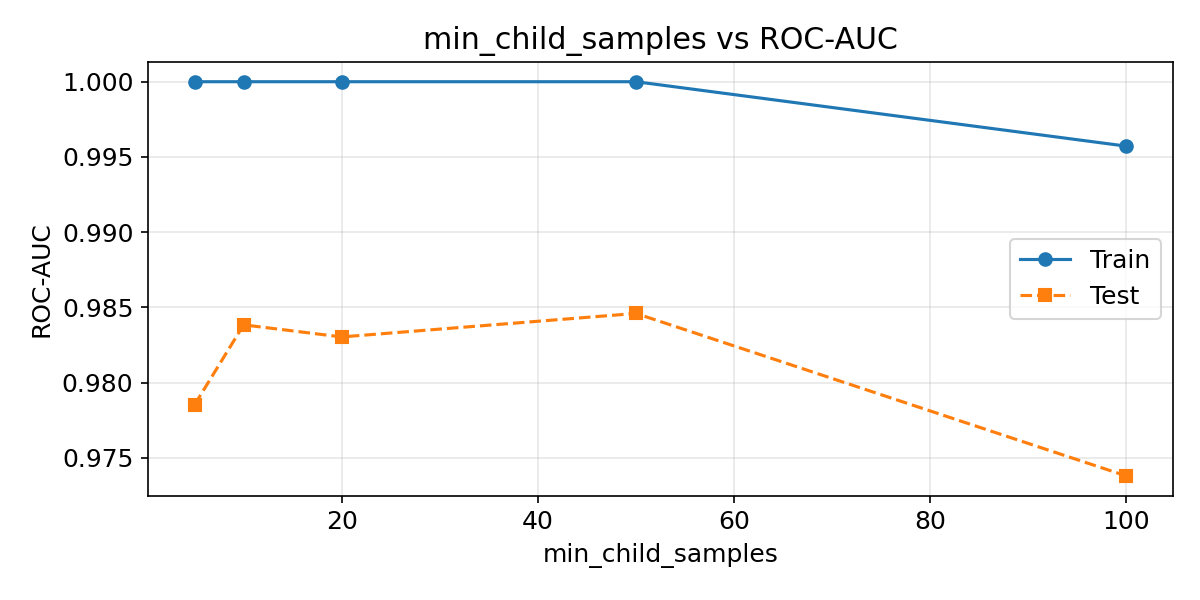
min_child_samplesの影響
#
葉ノードの最小サンプル数を増やすと、過学習を抑制できます。
 1
 2
 3
 4
 5
 6
 7
 8
 9
10
11
12
13
14
15
16
17
18
19
20
21
| min_samples = [5, 10, 20, 50, 100]
train_scores, test_scores = [], []
for ms in min_samples:
m = LGBMClassifier(
n_estimators=100, num_leaves=31,
learning_rate=0.1, min_child_samples=ms,
random_state=42, verbose=-1,
)
m.fit(X_train, y_train)
train_scores.append(roc_auc_score(y_train, m.predict_proba(X_train)[:, 1]))
test_scores.append(roc_auc_score(y_test, m.predict_proba(X_test)[:, 1]))
plt.figure(figsize=(8, 4))
plt.plot(min_samples, train_scores, "o-", label="Train")
plt.plot(min_samples, test_scores, "s--", label="Test")
plt.xlabel("min_child_samples")
plt.ylabel("ROC-AUC")
plt.title("min_child_samples vs ROC-AUC")
plt.legend()
plt.grid(True, alpha=0.3)
plt.show()
|
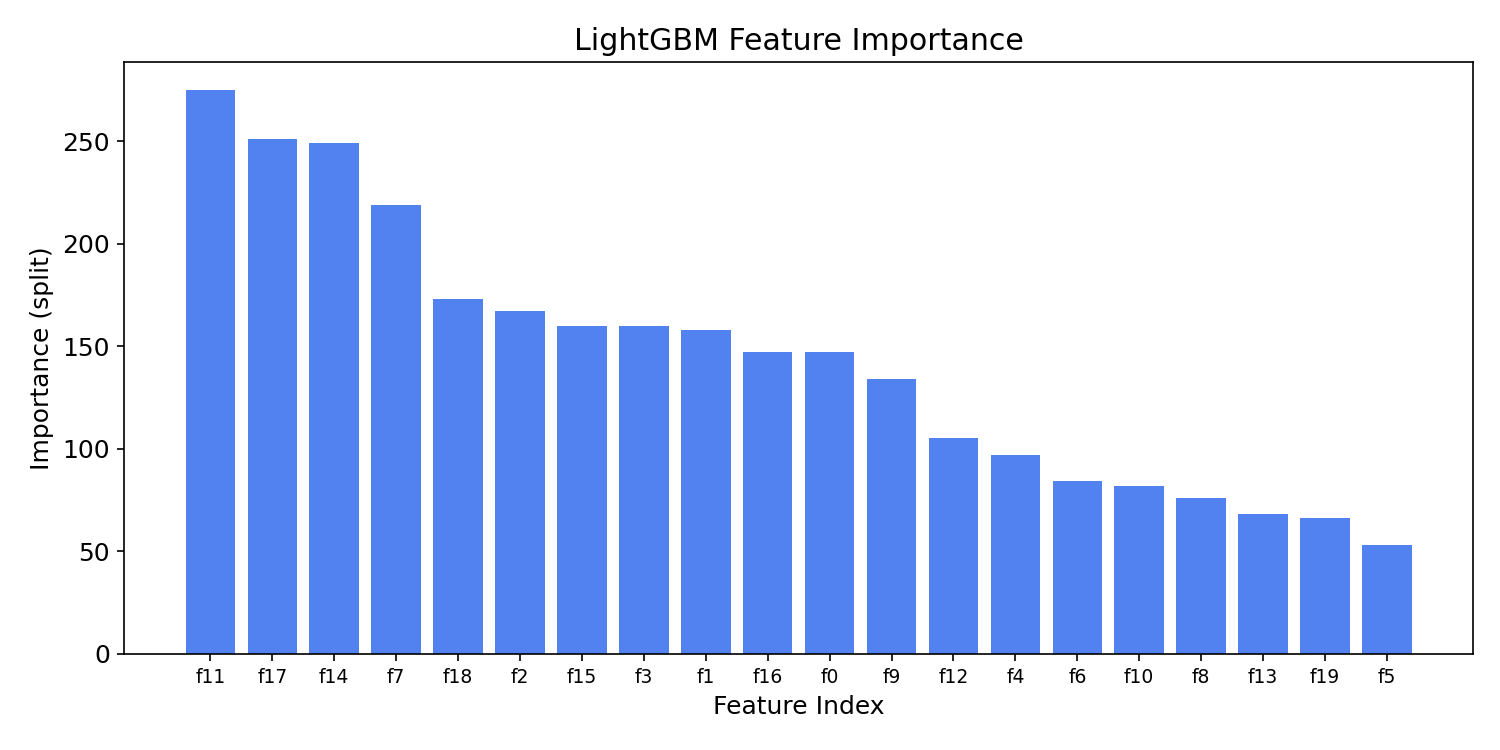
特徴量の重要度
#
 1
 2
 3
 4
 5
 6
 7
 8
 9
10
| importances = model.feature_importances_
indices = np.argsort(importances)[::-1]
plt.figure(figsize=(10, 5))
plt.bar(range(len(importances)), importances[indices], color="#2563eb", alpha=0.8)
plt.xlabel("Feature Index")
plt.ylabel("Importance (split)")
plt.title("LightGBM Feature Importance")
plt.xticks(range(len(importances)), [f"f{i}" for i in indices], fontsize=9)
plt.show()
|
Level-wiseとLeaf-wiseの違い
#
通常の勾配ブースティング(XGBoostのデフォルトなど)はLevel-wise、すなわち深さごとに全ノードを分割します。一方LightGBMはLeaf-wise、つまり損失をもっとも減らせる葉だけを分割します。
- Level-wise: バランスの取れた木になりやすく、過学習しにくい
- Leaf-wise: 同じ葉数ならより低い損失を達成できるが、深くなりすぎると過学習する
このため、LightGBMではmax_depthよりもnum_leavesでモデルの複雑さを制御するのが基本です。
Leaf-wise成長のため、num_leavesを大きくしすぎると急速に過学習します。num_leavesは2^max_depthより小さく設定するのが目安です。たとえばmax_depth=6ならnum_leavesは63以下に抑えてください。
チューニングはnum_leaves → learning_rate → min_child_samples → n_estimatorsの順が効率的です。カテゴリ変数はOne-Hot Encodingせず、データ型をcategoryにしてそのまま渡すとLightGBMが最適な分割を自動で見つけます。
まとめ
#
- LightGBMはLeaf-wise成長とヒストグラム近似により、大規模データでも高速に勾配ブースティングを実行できます。
num_leavesがモデルの複雑さをもっとも直接的に制御するパラメーターで、max_depthより優先して調整します。- カテゴリ変数のネイティブ処理により、前処理の手間を削減しながら高い精度を実現できます。
- TrainとTestのスコア乖離を確認しながら
min_child_samplesやlearning_rateで過学習を抑制します。
推定器数と LightGBM
#
推定器数を増やすと LightGBM の予測がどう改善するか確認できます。