 1
 2
 3
 4
 5
 6
 7
 8
 9
10
11
12
13
14
15
16
17
18
19
20
21
22
23
24
25
26
27
28
29
30
31
32
33
34
35
36
37
38
39
40
41
42
43
44
45
46
47
48
49
50
51
52
53
54
55
56
57
58
59
60
61
62
63
64
65
66
67
68
69
70
71
72
73
74
75
76
77
78
79
80
81
82
83
84
85
86
87
88
89
90
91
92
93
94
95
96
97
98
99
100
101
102
103
104
105
106
107
108
109
110
111
112
113
114
| from sklearn.model_selection import cross_val_score, KFold
from sklearn.linear_model import LinearRegression, Ridge, Lasso, ElasticNet
from sklearn.cross_decomposition import PLSRegression
from sklearn.decomposition import PCA
from sklearn.preprocessing import StandardScaler
from sklearn.pipeline import Pipeline
from sklearn.base import clone
import seaborn as sns
cv = KFold(n_splits=5, shuffle=True, random_state=42)
def make_pcr(n_components=3):
return Pipeline([
("scaler", StandardScaler()),
("pca", PCA(n_components=n_components)),
("reg", LinearRegression()),
])
models = {
"OLS": LinearRegression(),
"Ridge": Ridge(alpha=1.0),
"Lasso": Lasso(alpha=0.1),
"ElasticNet": ElasticNet(alpha=0.1, l1_ratio=0.5),
"PLS(3)": PLSRegression(n_components=3),
"PCR(3)": make_pcr(3),
}
results = []
coef_records = []
for mdl_name, mdl in models.items():
maes, r2s = [], []
fold_coefs = []
for train_idx, test_idx in cv.split(X):
X_tr, X_te = X[train_idx], X[test_idx]
y_tr, y_te = y[train_idx], y[test_idx]
m = clone(mdl)
try:
if mdl_name.startswith("PLS"):
m.fit(X_tr, y_tr.reshape(-1, 1))
pred = m.predict(X_te).ravel()
coefs = m.coef_.ravel()
else:
m.fit(X_tr, y_tr)
pred = m.predict(X_te)
if hasattr(m, "coef_"):
coefs = m.coef_.ravel()
elif hasattr(m, "named_steps"):
coefs = np.full(5, np.nan) # PCR: coefficients not directly comparable
else:
coefs = np.full(5, np.nan)
maes.append(np.mean(np.abs(y_te - pred)))
r2 = 1 - np.sum((y_te - pred)**2) / np.sum((y_te - np.mean(y_te))**2)
r2s.append(r2)
if len(coefs) == 5:
fold_coefs.append(coefs)
except Exception:
maes.append(np.nan)
r2s.append(np.nan)
results.append({
"モデル": mdl_name,
"MAE": np.nanmean(maes),
"R²": np.nanmean(r2s),
})
if fold_coefs:
coef_arr = np.array(fold_coefs)
for j, fname in enumerate(feature_names):
coef_records.append({
"モデル": mdl_name, "特徴量": fname,
"係数平均": coef_arr[:, j].mean(),
"係数std": coef_arr[:, j].std(),
})
df_res = pd.DataFrame(results)
fig, axes = plt.subplots(1, 2, figsize=(14, 5))
# MAE / R² 棒グラフ
mdl_order = ["OLS", "Ridge", "Lasso", "ElasticNet", "PLS(3)", "PCR(3)"]
df_plot = df_res.set_index("モデル").reindex(mdl_order)
colors_mae = ["#ef4444" if v > df_plot["MAE"].median() else "#10b981" for v in df_plot["MAE"]]
bars = axes[0].barh(df_plot.index, df_plot["MAE"], color=colors_mae, edgecolor="white")
for bar, v in zip(bars, df_plot["MAE"]):
if not np.isnan(v):
axes[0].text(bar.get_width() + 0.02, bar.get_y() + bar.get_height() / 2,
f"{v:.2f}", va="center", fontsize=9)
axes[0].set_title("MAE 比較(低いほど良い)")
axes[0].set_xlabel("MAE")
axes[0].grid(alpha=0.2, axis="x")
# 係数の安定性(std)
df_coef = pd.DataFrame(coef_records)
if len(df_coef) > 0:
pivot_std = df_coef.pivot_table(index="モデル", columns="特徴量", values="係数std")
pivot_std = pivot_std.reindex(
index=[m for m in mdl_order if m in pivot_std.index],
columns=feature_names
)
sns.heatmap(pivot_std, annot=True, fmt=".2f", cmap="RdYlGn_r",
linewidths=0.5, ax=axes[1],
cbar_kws={"label": "係数の標準偏差(低いほど安定)"})
axes[1].set_title("CV間の係数変動(std)")
axes[1].set_xlabel("")
axes[1].set_ylabel("")
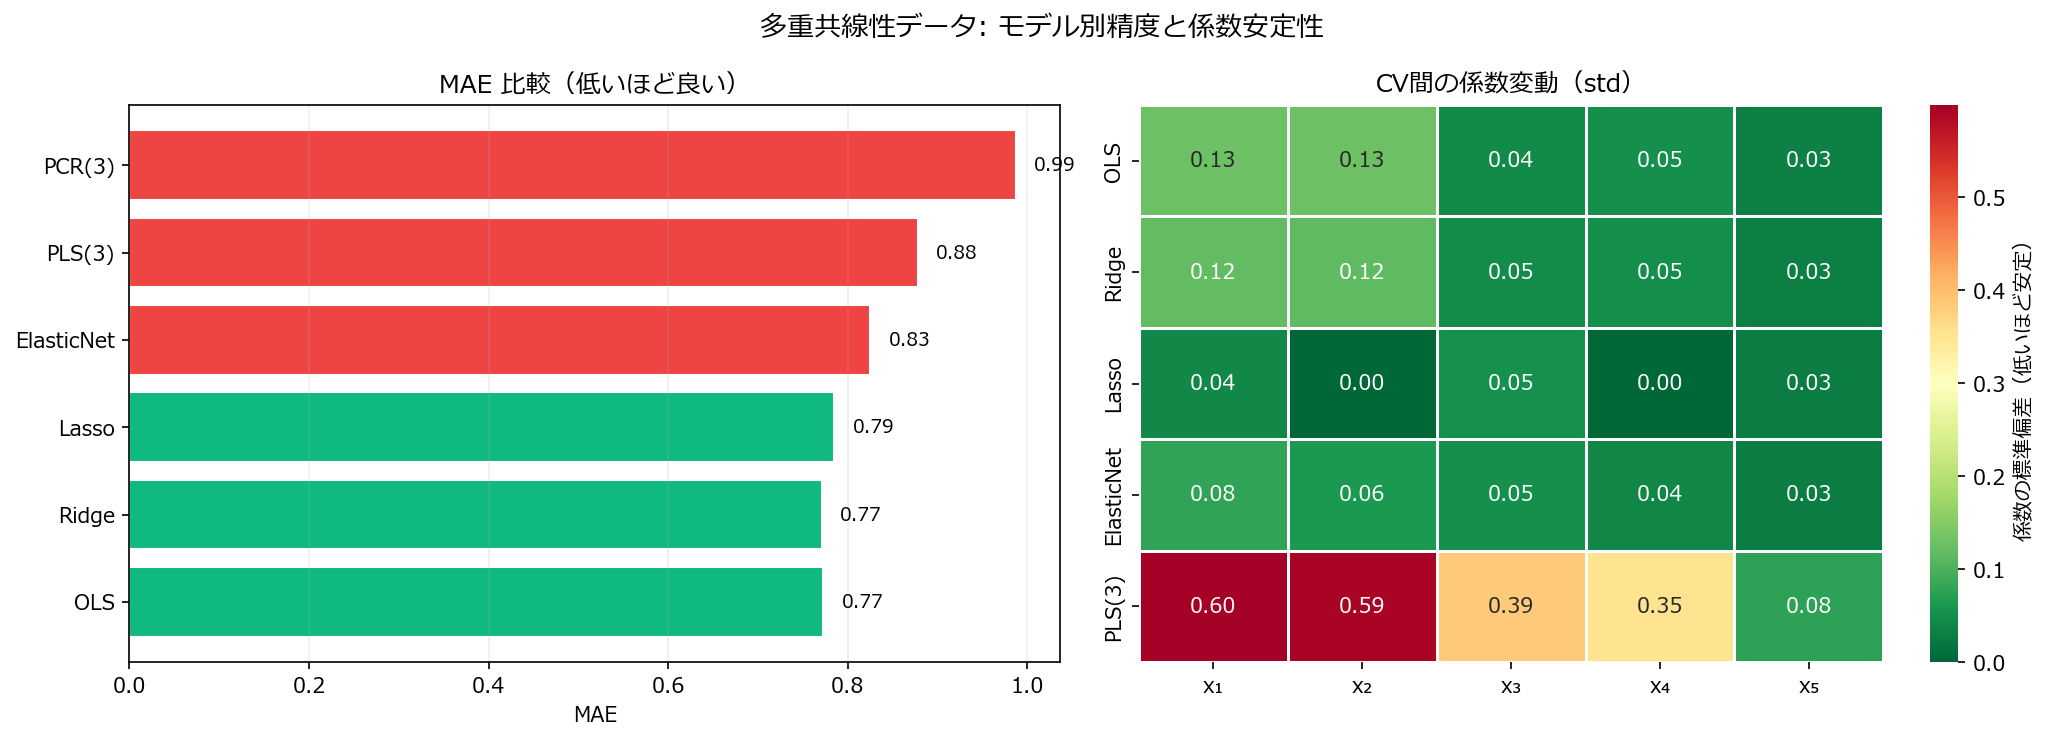
fig.suptitle("多重共線性データ: モデル別精度と係数安定性", fontsize=13)
fig.tight_layout()
plt.show()
|