 1
 2
 3
 4
 5
 6
 7
 8
 9
10
11
12
13
14
15
16
17
18
19
20
21
22
23
24
25
26
27
28
29
30
31
32
33
34
35
36
37
38
39
40
41
42
43
44
| import numpy as np
import matplotlib.pyplot as plt
from matplotlib.patches import Rectangle
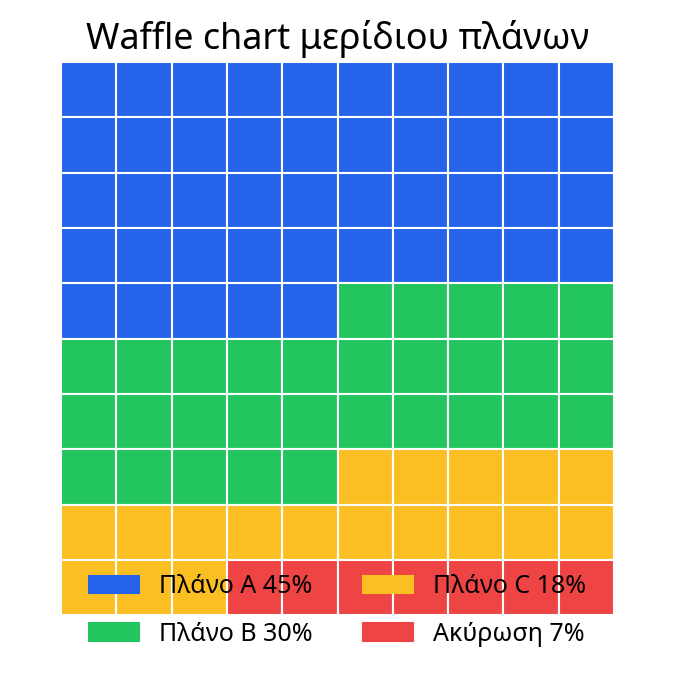
labels = ["Πλάνο A", "Πλάνο B", "Πλάνο C", "Ακύρωση"]
share = np.array([0.45, 0.30, 0.18, 0.07])
colors = ["#2563eb", "#22c55e", "#fbbf24", "#ef4444"]
grid_size = 10
tiles = np.round(share * grid_size * grid_size).astype(int)
tiles[-1] = grid_size * grid_size - tiles[:-1].sum() # Διόρθωση στρογγυλοποίησης
fig, ax = plt.subplots(figsize=(4.5, 4.5))
ax.set_xticks([])
ax.set_yticks([])
ax.set_aspect("equal")
start = 0
for color, count in zip(colors, tiles):
for n in range(count):
row = (start + n) // grid_size
col = (start + n) % grid_size
ax.add_patch(
Rectangle((col, grid_size - 1 - row), 1, 1, facecolor=color, edgecolor="white")
)
start += count
ax.set_xlim(0, grid_size)
ax.set_ylim(0, grid_size)
ax.set_title("Waffle chart μερίδιου πλάνων")
legend_handles = [Rectangle((0, 0), 1, 1, color=c) for c in colors]
ax.legend(
legend_handles,
[f"{l} {s*100:.0f}%" for l, s in zip(labels, share)],
loc="lower center",
ncol=2,
frameon=False,
bbox_to_anchor=(0.5, -0.12),
)
fig.tight_layout()
plt.show()
|