2.9.1
ADTK basics
Summary
- ADTK provides modular threshold and statistical detectors for practical time-series anomaly detection.
rn- Detection quality depends on feature engineering and detector composition, not on a single universal model.rn- Visual inspection of detected segments is essential to balance false positives and missed events.
Intuition #
ADTK is a pipeline mindset: transform the signal, then apply detectors suited to the pattern. The method is effective when detector design reflects seasonality, trend, and expected noise levels.
Detailed Explanation #
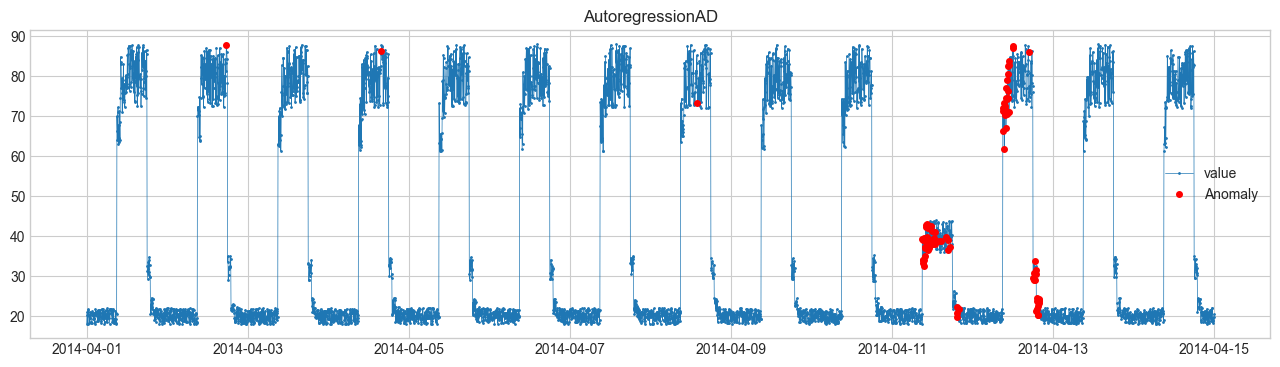
We will perform anomaly detection using the Anomaly Detection Toolkit (ADTK).
The original data is sourced from the Numenta Anomaly Benchmark.
| |
timestamp
2014-04-01 00:00:00    18.090486
2014-04-01 00:05:00    20.359843
2014-04-01 00:10:00    21.105470
2014-04-01 00:15:00    21.151585
2014-04-01 00:20:00    18.137141
                         ...
2014-04-14 23:35:00    18.269290
2014-04-14 23:40:00    19.087351
2014-04-14 23:45:00    19.594689
2014-04-14 23:50:00    19.767817
2014-04-14 23:55:00    20.479156
Freq: 5T, Name: value, Length: 4032, dtype: float64


  s_train = pd.read_csv("./training.csv", index_col="timestamp", parse_dates=True, squeeze=True)
| |
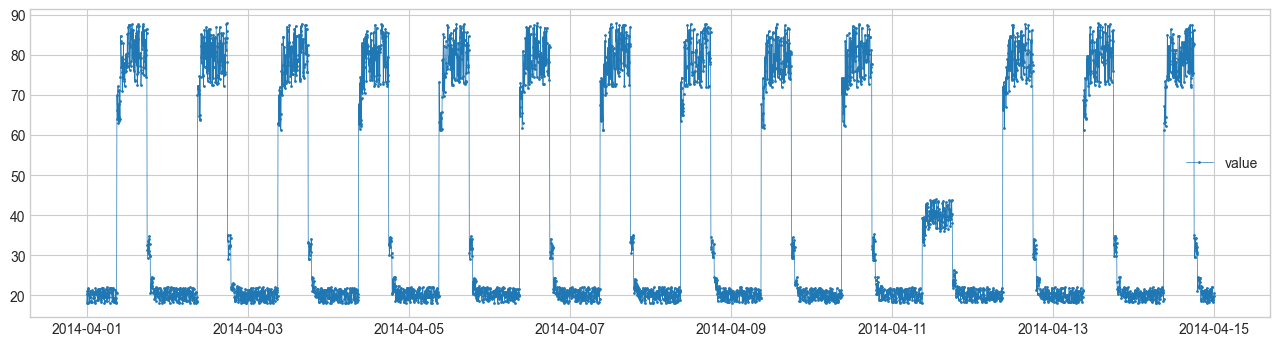
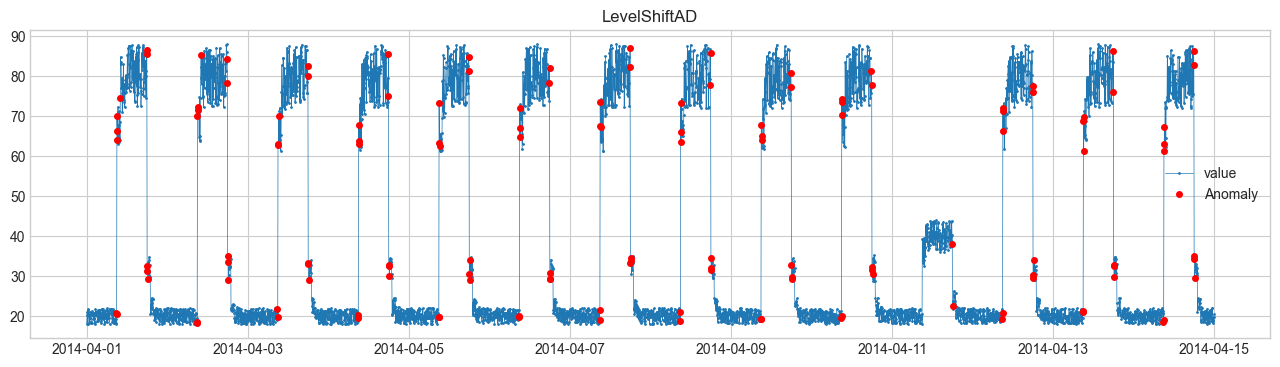
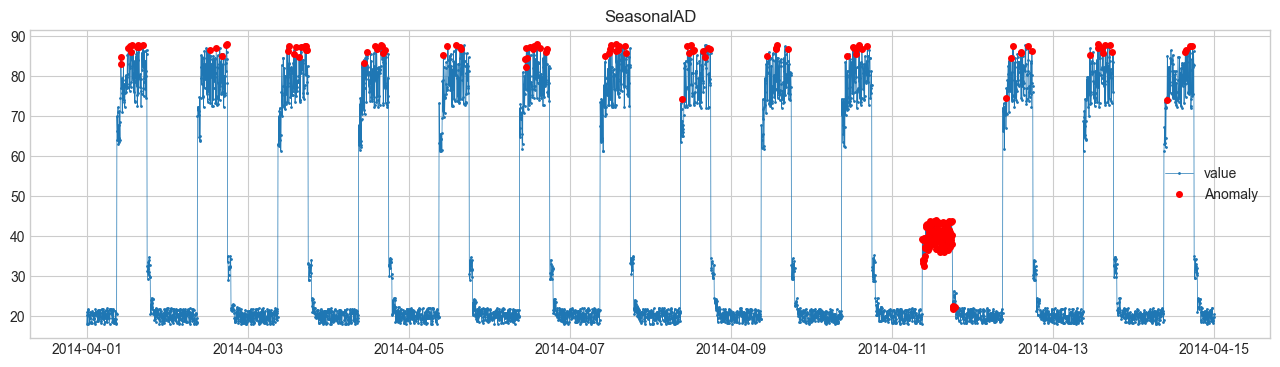
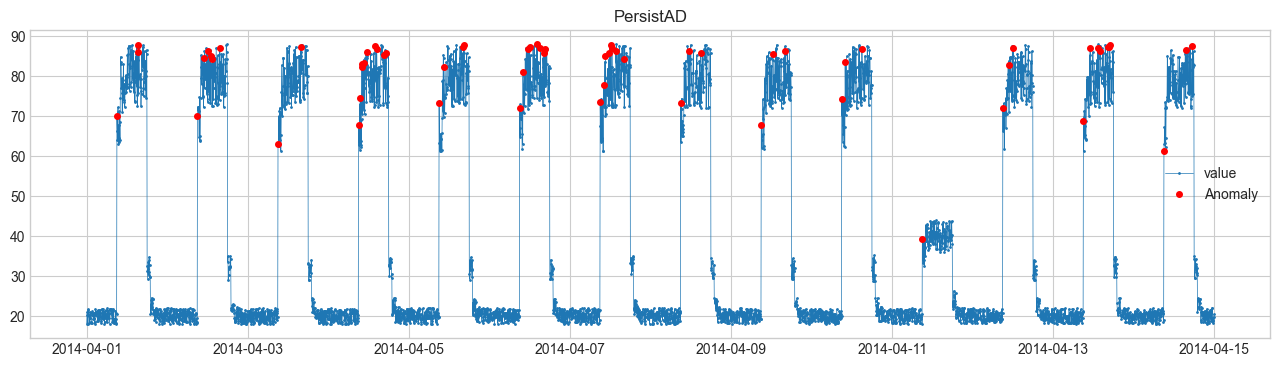
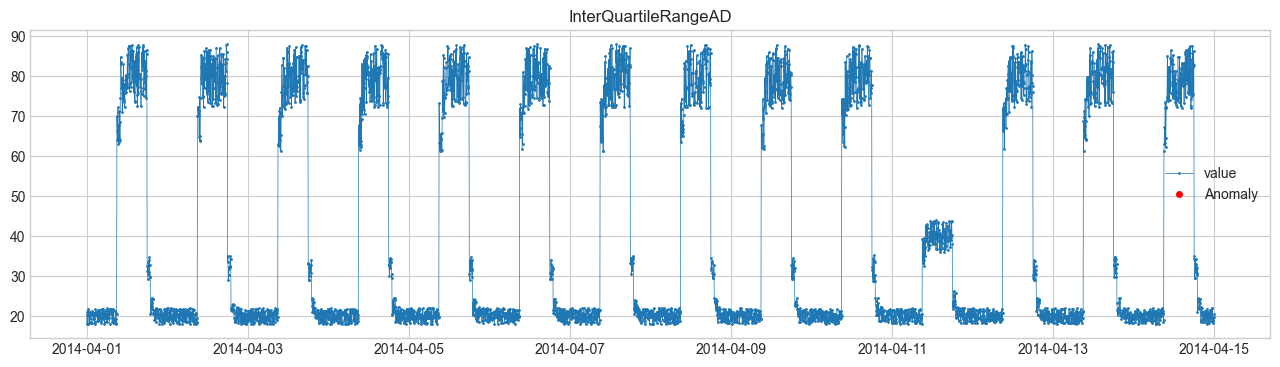
Comparison of Anomaly Detection Methods #
We will perform anomaly detection using SeasonalAD.
For other methods, refer to Detector.
| |