2.9.2
ADTK advanced
Summary
- ADTK part 2 extends detection with window-based and seasonal detectors for context-aware anomalies.
rn- Combining detectors improves recall for complex patterns that simple thresholds miss.rn- Comparing detector outputs on timelines helps align model behavior with operational requirements.
- Anomaly Detection (ADTK Part 1) — understanding this concept first will make learning smoother
Intuition #
The key upgrade in ADTK part 2 is contextual detection: the same value can be normal or abnormal depending on local window behavior and seasonality.
Detailed Explanation #
Let’s try anomaly detection using the Anomaly Detection Toolkit (ADTK).
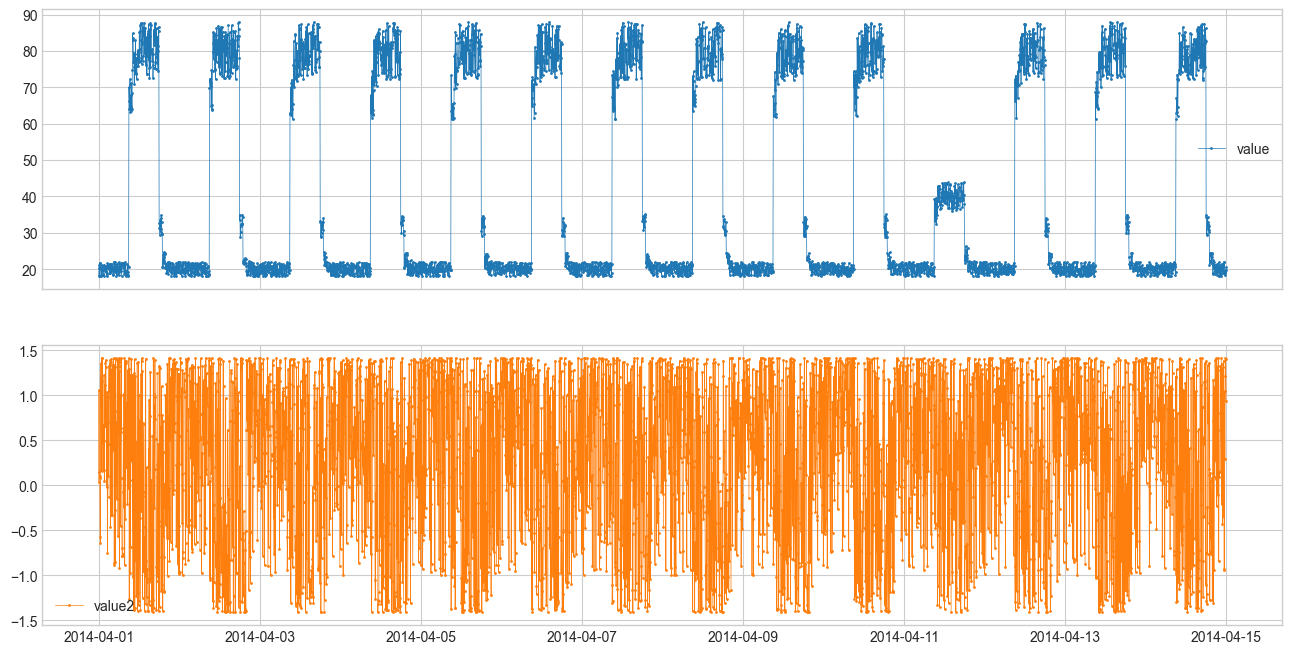
We will apply anomaly detection to multidimensional synthetic data. This time, we will work with data across multiple dimensions.
| |
| value | value2 | |
|---|---|---|
| timestamp | ||
| 2014-04-01 00:00:00 | 18.090486 | 0.037230 |
| 2014-04-01 00:05:00 | 20.359843 | 1.058643 |
| 2014-04-01 00:10:00 | 21.105470 | 0.141581 |
| 2014-04-01 00:15:00 | 21.151585 | 0.076564 |
| 2014-04-01 00:20:00 | 18.137141 | 0.103122 |
| ... | ... | ... |
| 2014-04-14 23:35:00 | 18.269290 | 0.288071 |
| 2014-04-14 23:40:00 | 19.087351 | 1.207420 |
| 2014-04-14 23:45:00 | 19.594689 | 1.413067 |
| 2014-04-14 23:50:00 | 19.767817 | 1.401750 |
| 2014-04-14 23:55:00 | 20.479156 | 0.939501 |
4032 rows × 2 columns
| |
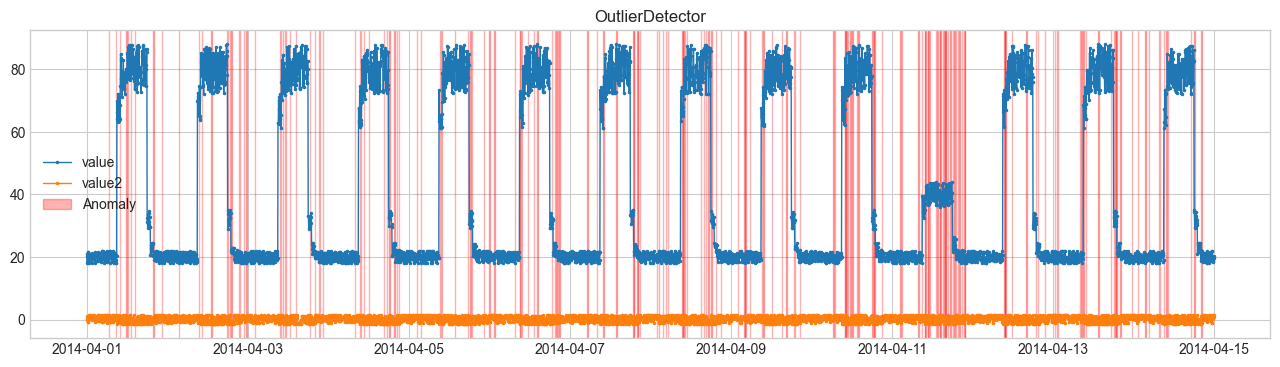
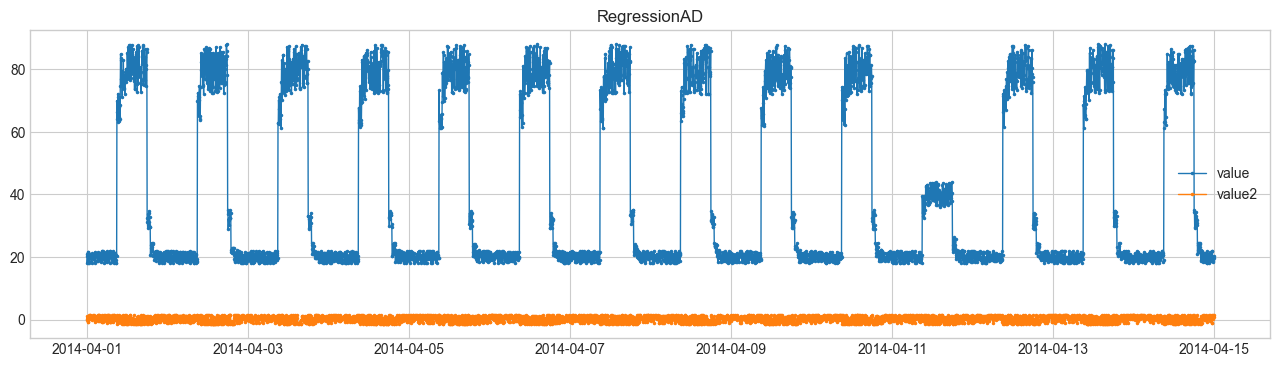
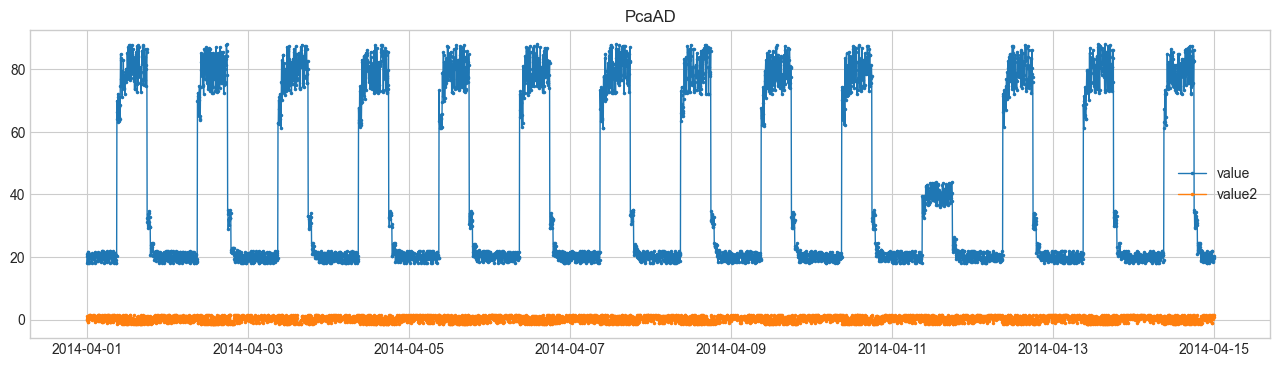
Comparison of Anomaly Detection Methods #
We will perform anomaly detection using SeasonalAD.
For other methods, refer to Detector.
| |