Summary- X-means extends K-means by estimating the number of clusters using split decisions evaluated with BIC/MDL criteria.
- Minimum and maximum cluster settings define the search range and prevent uncontrolled over-splitting.
- Comparing fixed-k K-means and X-means clarifies how model selection affects cluster interpretation.
Intuition
#
X-means follows a split-and-test strategy: start with coarse clusters, then split only when a statistical criterion indicates improvement. This reduces manual trial-and-error over k while keeping the optimization tractable.
Detailed Explanation
#
<p>X-means is a type of clustering algorithm that automatically determines the number of clusters as the clustering proceeds. This page compares the results of k-means++ and X-means.</p>
Pelleg, Dan, and Andrew W. Moore. “X-means: Extending k-means with efficient estimation of the number of clusters.” Icml. Vol. 1. 2000.
1
2
3
4
5
| import numpy as np
import matplotlib.pyplot as plt
from sklearn.cluster import KMeans
from sklearn.datasets import make_blobs
|
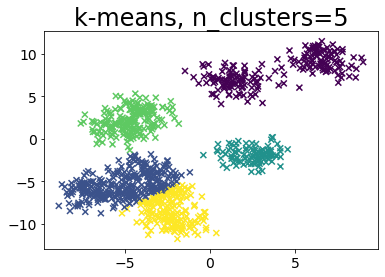
When k is pre-specified in k-means
#
 1
 2
 3
 4
 5
 6
 7
 8
 9
10
11
12
13
14
15
16
17
| def plot_by_kmeans(X, k=5):
y_pred = KMeans(n_clusters=k, random_state=random_state, init="random").fit_predict(
X
)
plt.scatter(X[:, 0], X[:, 1], c=y_pred, marker="x")
plt.title(f"k-means, n_clusters={k}")
# Create sample data
n_samples = 1000
random_state = 117117
X, _ = make_blobs(
n_samples=n_samples, random_state=random_state, cluster_std=1, centers=10
)
# Run k-means++.
plot_by_kmeans(X)
|
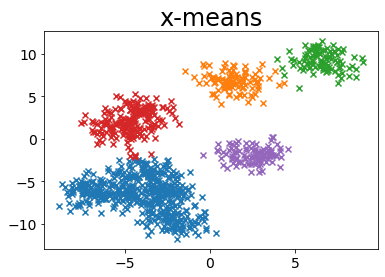
Run without specifying the number of clusters in x-mean
#
 1
 2
 3
 4
 5
 6
 7
 8
 9
10
11
12
13
14
15
16
17
18
19
20
21
22
23
24
25
26
27
| from pyclustering.cluster.xmeans import xmeans
from pyclustering.cluster.center_initializer import kmeans_plusplus_initializer
BAYESIAN_INFORMATION_CRITERION = 0
MINIMUM_NOISELESS_DESCRIPTION_LENGTH = 1
def plot_by_xmeans(
X, c_min=3, c_max=10, criterion=BAYESIAN_INFORMATION_CRITERION, tolerance=0.025
):
initial_centers = kmeans_plusplus_initializer(X, c_min).initialize()
xmeans_instance = xmeans(
X, initial_centers, c_max, criterion=criterion, tolerance=tolerance
)
xmeans_instance.process()
# Create data for plots
clusters = xmeans_instance.get_clusters()
n_samples = X.shape[0]
c = []
for i, cluster_i in enumerate(clusters):
X_ci = X[cluster_i]
color_ci = [i for _ in cluster_i]
plt.scatter(X_ci[:, 0], X_ci[:, 1], marker="x")
plt.title("x-means")
# Run x-means
plot_by_xmeans(X, c_min=3, c_max=10, criterion=BAYESIAN_INFORMATION_CRITERION)
|
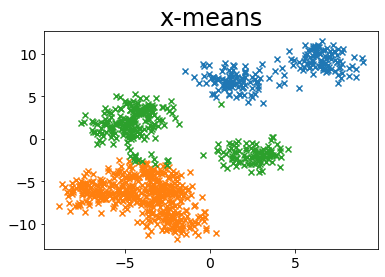
MINIMUM_NOISELESS_DESCRIPTION_LENGTH
#
1
| plot_by_xmeans(X, c_min=3, c_max=10, criterion=MINIMUM_NOISELESS_DESCRIPTION_LENGTH)
|
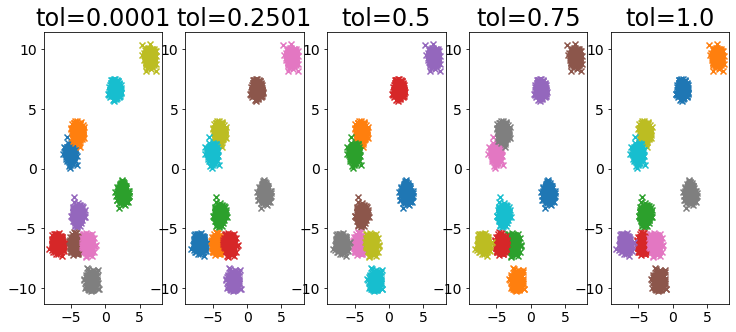
Influence of tolerance parameter
#
 1
 2
 3
 4
 5
 6
 7
 8
 9
10
11
12
13
14
15
| X, _ = make_blobs(
n_samples=2000,
random_state=random_state,
cluster_std=0.4,
centers=10,
)
plt.figure(figsize=(25, 5))
for i, ti in enumerate(np.linspace(0.0001, 1, 5)):
ti = np.round(ti, 4)
plt.subplot(1, 10, i + 1)
plot_by_xmeans(
X, c_min=3, c_max=10, criterion=BAYESIAN_INFORMATION_CRITERION, tolerance=ti
)
plt.title(f"tol={ti}")
|
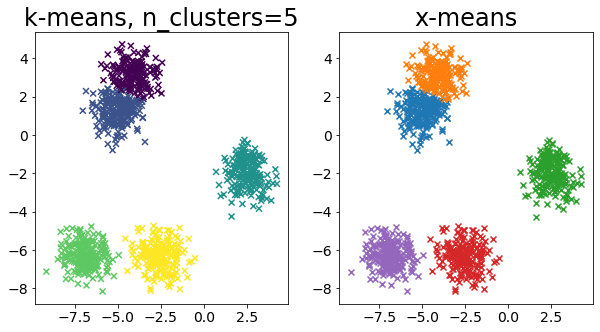
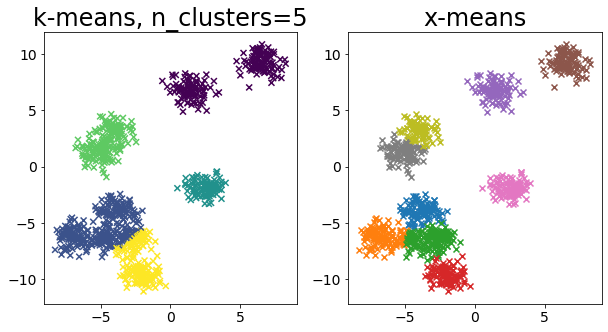
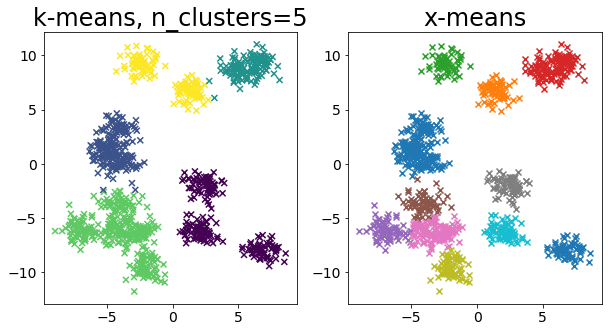
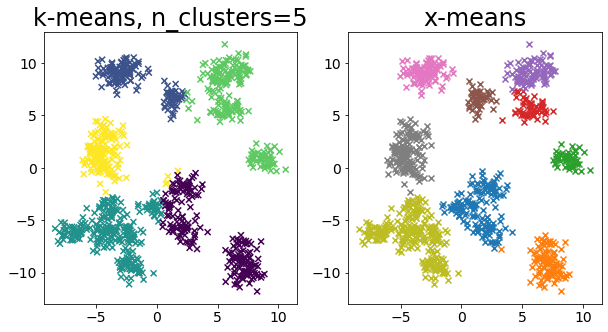
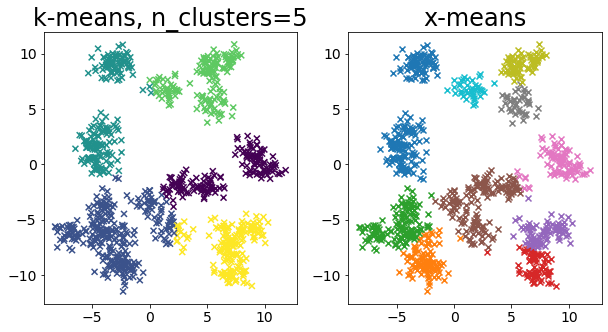
Compare k-means and x-means for various data
#
 1
 2
 3
 4
 5
 6
 7
 8
 9
10
11
12
13
| for i in range(5):
X, _ = make_blobs(
n_samples=n_samples,
random_state=random_state,
cluster_std=0.7,
centers=5 + i * 5,
)
plt.figure(figsize=(10, 5))
plt.subplot(1, 2, 1)
plot_by_kmeans(X)
plt.subplot(1, 2, 2)
plot_by_xmeans(X, c_min=3, c_max=20)
plt.show()
|