Summary- Stacking trains multiple base models, then feeds their out-of-fold predictions into a meta-model.
- The meta-model learns how to combine complementary strengths of different learners.
- Proper out-of-fold construction is essential to prevent leakage and to keep validation performance trustworthy.
Intuition
#
Instead of picking one best model, stacking learns a second-level model that decides when each base model should be trusted. It works well when base learners make different kinds of errors.
Detailed Explanation
#
 1
 2
 3
 4
 5
 6
 7
 8
 9
10
| import matplotlib.pyplot as plt
from sklearn.datasets import make_classification
from sklearn.tree import DecisionTreeClassifier
from sklearn.ensemble import RandomForestClassifier
from sklearn.ensemble import StackingClassifier
from sklearn.model_selection import train_test_split
from sklearn.metrics import roc_auc_score
from sklearn.tree import export_graphviz
from subprocess import call
|
Create data for experiment
#
 1
 2
 3
 4
 5
 6
 7
 8
 9
10
11
12
13
14
| # Create data with 20 features
n_features = 20
X, y = make_classification(
n_samples=2500,
n_features=n_features,
n_informative=10,
n_classes=2,
n_redundant=0,
n_clusters_per_class=4,
random_state=777,
)
X_train, X_test, y_train, y_test = train_test_split(
X, y, test_size=0.33, random_state=777
)
|
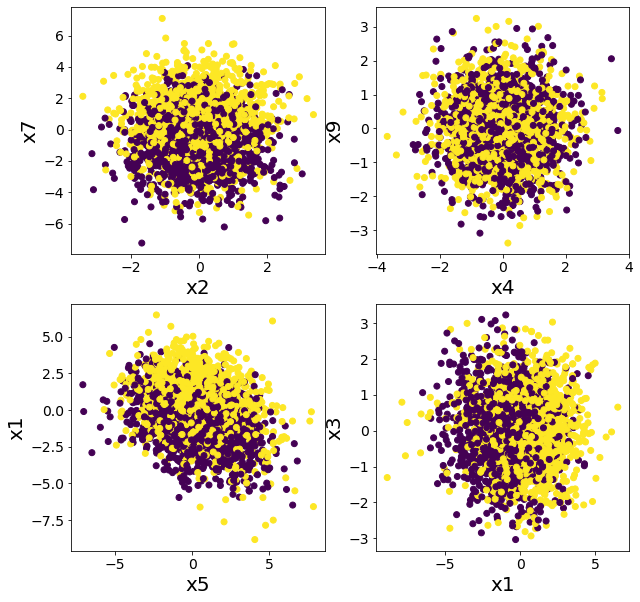
Plot the data with respect to multiple features
#
Confirm that it does not appear to be classifiable by simple rules.
 1
 2
 3
 4
 5
 6
 7
 8
 9
10
11
12
13
14
15
16
17
18
| plt.figure(figsize=(10, 10))
plt.subplot(2, 2, 1)
plt.scatter(X[:, 2], X[:, 7], c=y)
plt.xlabel("x2")
plt.ylabel("x7")
plt.subplot(2, 2, 2)
plt.scatter(X[:, 4], X[:, 9], c=y)
plt.xlabel("x4")
plt.ylabel("x9")
plt.subplot(2, 2, 3)
plt.scatter(X[:, 5], X[:, 1], c=y)
plt.xlabel("x5")
plt.ylabel("x1")
plt.subplot(2, 2, 4)
plt.scatter(X[:, 1], X[:, 3], c=y)
plt.xlabel("x1")
plt.ylabel("x3")
plt.show()
|
Stacking vs. Random Forest
#
Classification with Random Forest
#
1
2
3
4
5
| model = RandomForestClassifier(n_estimators=50, max_depth=5, random_state=777)
model.fit(X_train, y_train)
y_pred = model.predict(X_test)
rf_score = roc_auc_score(y_test, y_pred)
print(f"ROC-AUC = {rf_score}")
|
ROC-AUC = 0.855797033310609
When stacking with multiple trees
#
We can confirm that stacking with only DecisionTreeClassifier does not improve accuracy much.
 1
 2
 3
 4
 5
 6
 7
 8
 9
10
11
12
13
14
15
16
17
18
19
20
| # Models used in base learner
estimators = [
("dt1", DecisionTreeClassifier(max_depth=3, random_state=777)),
("dt2", DecisionTreeClassifier(max_depth=4, random_state=777)),
("dt3", DecisionTreeClassifier(max_depth=5, random_state=777)),
("dt4", DecisionTreeClassifier(max_depth=6, random_state=777)),
]
# Number of models included in base learner
n_estimators = len(estimators)
# aggregation model
final_estimator = DecisionTreeClassifier(max_depth=3, random_state=777)
# train base-learner and aggregation model
clf = StackingClassifier(estimators=estimators, final_estimator=final_estimator)
clf.fit(X_train, y_train)
# evaluate
y_pred = clf.predict(X_test)
clf_score = roc_auc_score(y_test, y_pred)
print("ROC-AUC")
print(f"Decision Tree Stacking={clf_score}, Random Forest={rf_score}")
|
ROC-AUC
Decision Tree Stacking=0.7359716965608031, Random Forest=0.855797033310609
Visualize trees used for stacking
#
 1
 2
 3
 4
 5
 6
 7
 8
 9
10
11
12
13
14
15
16
17
18
19
20
| export_graphviz(
clf.final_estimator_,
out_file="tree_final_estimator.dot",
class_names=["A", "B"],
feature_names=[e[0] for e in estimators],
proportion=True,
filled=True,
)
call(
[
"dot",
"-Tpng",
"tree_final_estimator.dot",
"-o",
f"tree_final_estimator.png",
"-Gdpi=200",
]
)
display(Image(filename="tree_final_estimator.png"))
|
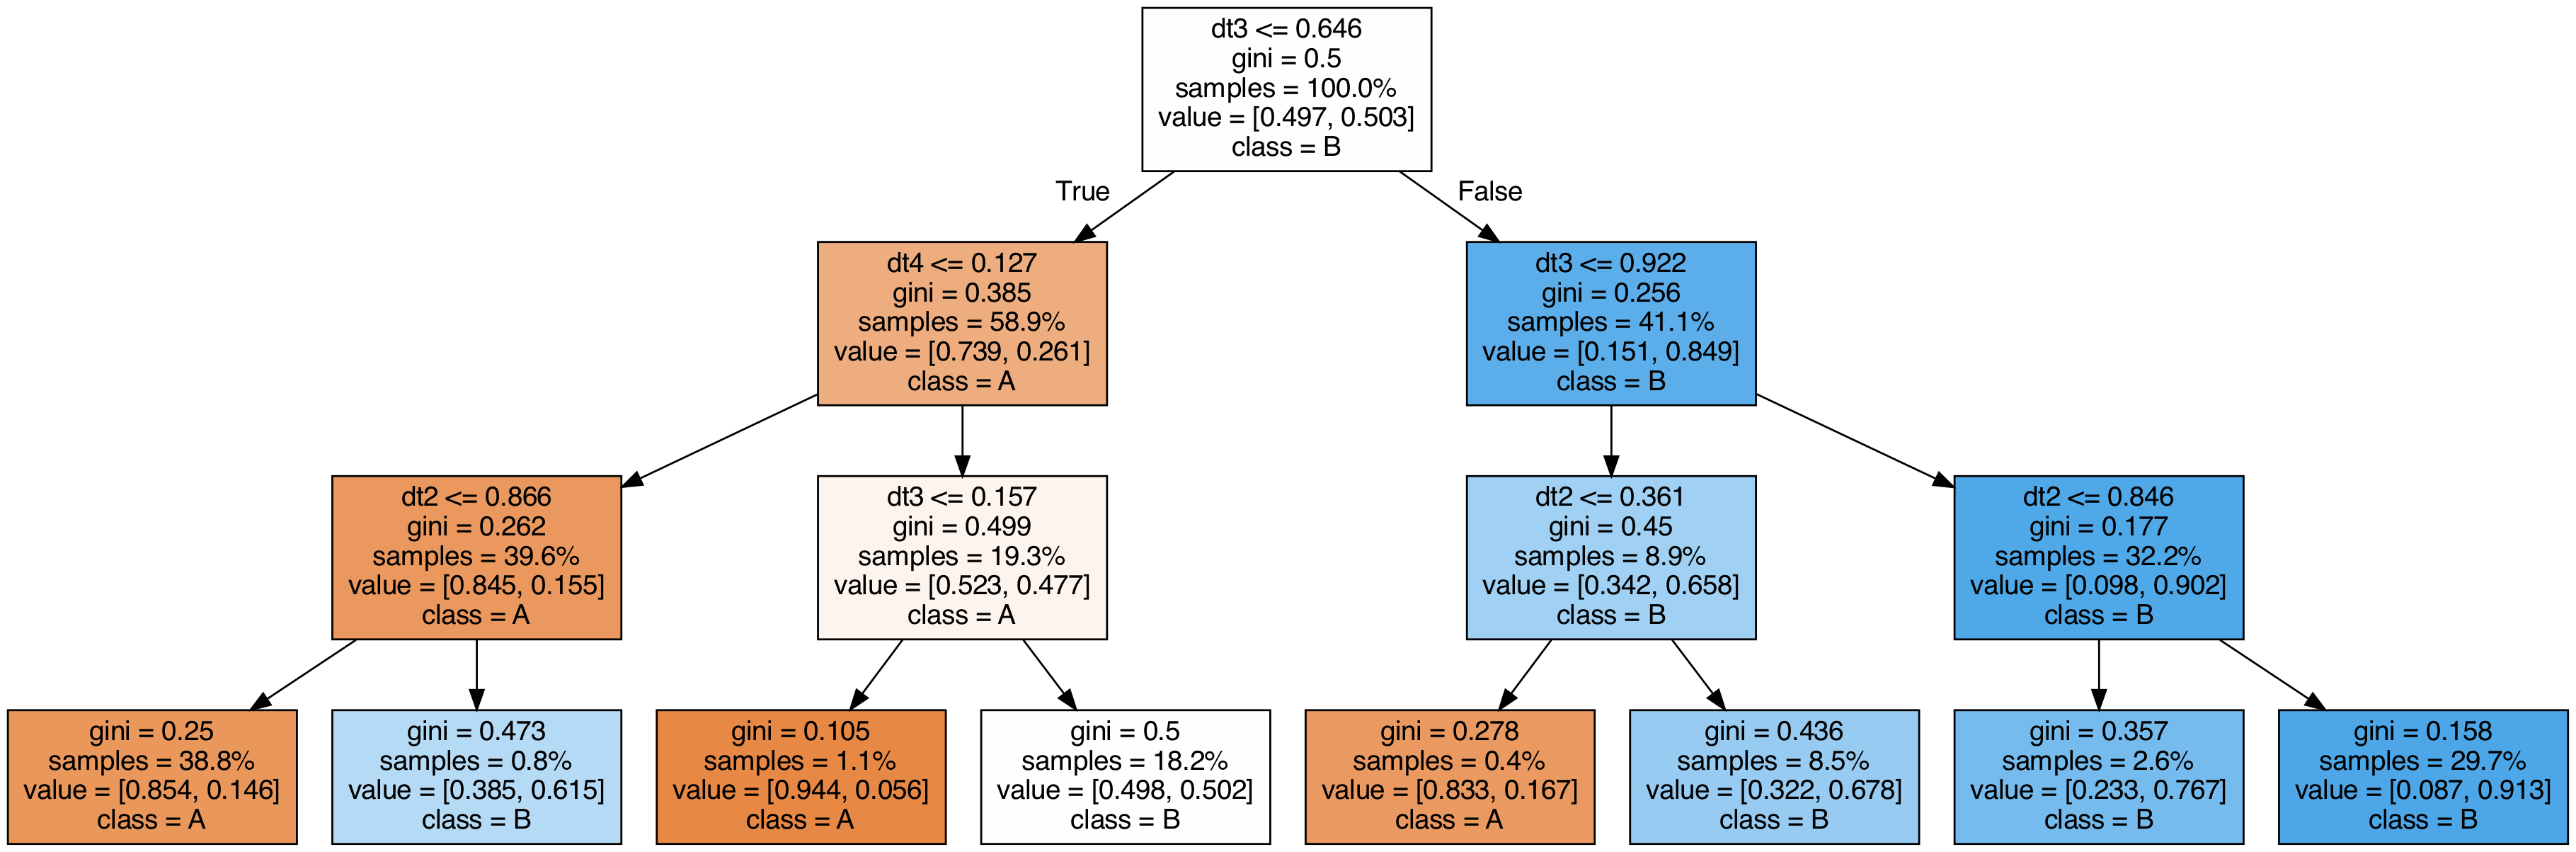
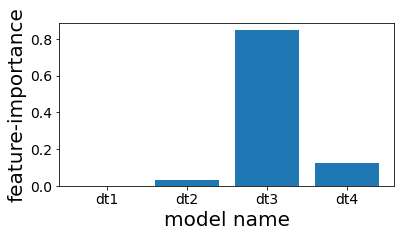
Look at the feature importance of the trees used in the stacking.
#
We see that although stacked, in the end only the fourth tree is used almost exclusively in the forecast.
1
2
3
4
5
6
7
| plt.figure(figsize=(6, 3))
plot_index = [i for i in range(n_estimators)]
plt.bar(plot_index, clf.final_estimator_.feature_importances_)
plt.xticks(plot_index, [e[0] for e in estimators])
plt.xlabel("model name")
plt.ylabel("feature-importance")
plt.show()
|
 1
 2
 3
 4
 5
 6
 7
 8
 9
10
11
12
13
14
15
16
17
18
| scores = []
for clf_estim in clf.estimators_:
print("====")
y_pred = clf_estim.predict(X_test)
scr = roc_auc_score(y_test, y_pred)
scores.append(scr)
print(clf_estim)
print(scr)
n_estimators = len(estimators)
plot_index = [i for i in range(n_estimators)]
plt.figure(figsize=(8, 4))
plt.bar(plot_index, scores)
plt.xticks(plot_index, [e[0] for e in estimators])
plt.xlabel("model name")
plt.ylabel("roc-auc")
plt.show()
|
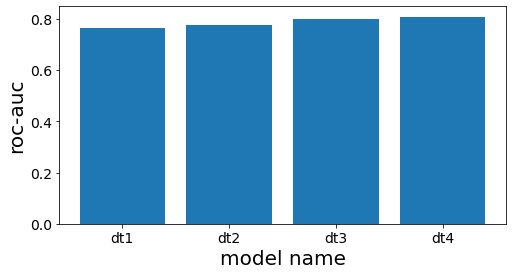
====
DecisionTreeClassifier(max_depth=3, random_state=777)
0.7660117774277722
====
DecisionTreeClassifier(max_depth=4, random_state=777)
0.7744128916993818
====
DecisionTreeClassifier(max_depth=5, random_state=777)
0.8000158677919086
====
DecisionTreeClassifier(max_depth=6, random_state=777)
0.8084639977432473