4.3.1
Accuracy
- Understand the fundamentals of this metric, what it evaluates, and how to interpret the results.
- Compute and visualise the metric with Python 3.13 code examples, covering key steps and practical checkpoints.
- Combine charts and complementary metrics for effective model comparison and threshold tuning.
- Confusion Matrix — understanding this concept first will make learning smoother
1. Definition #
Using the confusion-matrix entries (true positive TP, false positive FP, false negative FN, true negative TN), accuracy is defined as:
$$ \mathrm{Accuracy} = \frac{TP + TN}{TP + TN + FP + FN} $$It measures the overall hit rate, but by itself says nothing about class imbalance. Always pair it with other metrics when positive and negative samples appear at very different frequencies.
2. Implementation and visualisation on Python 3.13 #
Confirm the interpreter and install the required packages:
| |
The script below trains a random forest on the breast-cancer dataset, computes Accuracy and Balanced Accuracy, and plots both as a bar chart. A Pipeline with StandardScaler keeps the preprocessing consistent. Images are saved under static/images/eval/... so that generate_eval_assets.py can refresh them automatically.
| |
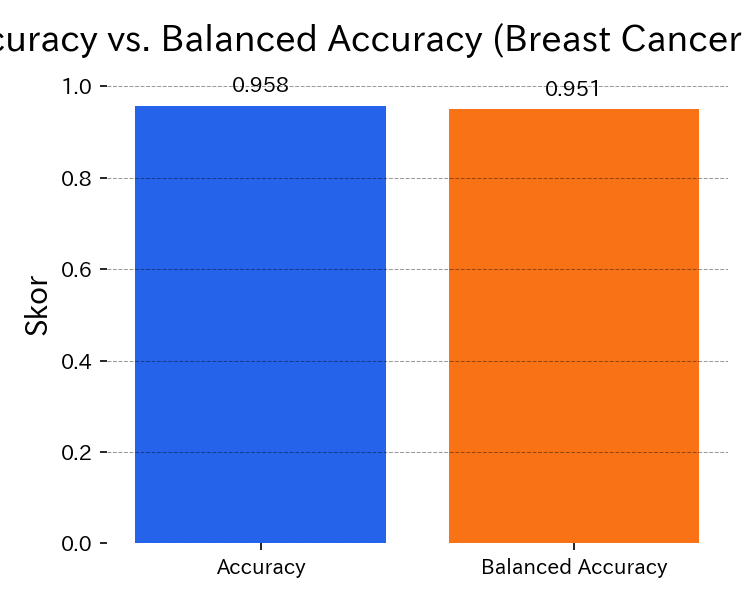
Balanced Accuracy exposes hidden errors when classes are imbalanced.
3. Handling class imbalance #
Accuracy does not differentiate the cost of false negatives vs. false positives. On skewed datasets, supplement it with:
- Precision / Recall / F1 — to understand false alarms versus misses.
- Balanced Accuracy — averages recall per class, making minority classes visible.
- Confusion Matrix — shows which classes dominate the mistakes.
- ROC-AUC / PR curves — inspect probability thresholds and trade-offs. Balanced Accuracy equals the mean recall of each class and is a good default when outcomes are skewed or when compliance requires a fairness-aware score.
4. Operational checklist #
Align with business cost – check the confusion matrix and confirm that the “99 % accuracy” claim does not mask critical misses.
Explore thresholding – analyse ROC-AUC or PR curves to see how accuracy changes when you adjust the decision threshold.
Report multiple metrics – include Precision, Recall, F1, and Balanced Accuracy in dashboards so stakeholders recognise trade-offs.
Keep reproducible notebooks – store the evaluation in a Python 3.13 notebook to re-run it quickly after model updates.
Summary #
- Accuracy is a convenient headline metric, but can mislead on imbalanced data.
- A scikit-learn pipeline with scaling makes the calculation reproducible in Python 3.13.
- Combine Accuracy with Balanced Accuracy and class-wise metrics to build a trustworthy evaluation narrative.