4.3.5
MCC
Summary
- Understand the fundamentals of this metric, what it evaluates, and how to interpret the results.
- Compute and visualise the metric with Python 3.13 code examples, covering key steps and practical checkpoints.
- Combine charts and complementary metrics for effective model comparison and threshold tuning.
- Confusion Matrix — understanding this concept first will make learning smoother
1. Definition #
For binary classification: \mathrm{MCC} = \frac{TP \cdot TN - FP \cdot FN}{\sqrt{(TP + FP)(TP + FN)(TN + FP)(TN + FN)}}.
- 1 → perfect prediction
- 0 → no better than random
- −1 → total disagreement Multiclass MCC generalises this formula using the complete confusion matrix.
2. Computing MCC in Python 3.13 #
| |
| |
class_weight=“balanced” helps the minority class contribute to the coefficient.
3. Threshold analysis #
Find the threshold where MCC peaks to strike the best balance between all confusion-matrix cells.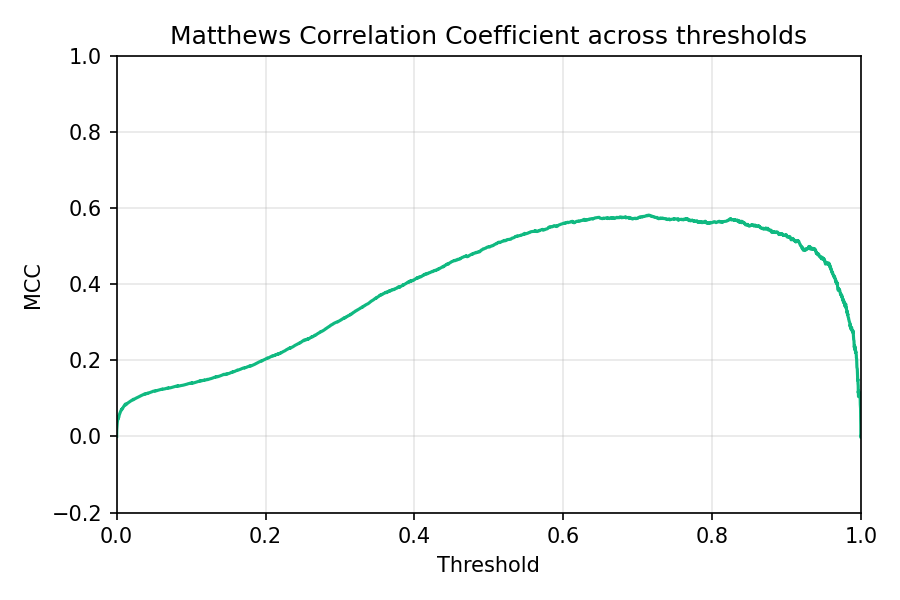
4. Practical use cases #
- Sanity-check Accuracy – a high Accuracy but low MCC signals that one class is being ignored.
- Model selection – use make_scorer(matthews_corrcoef) in GridSearchCV to optimise directly for MCC.
- Combine with ROC/PR curves – MCC highlights overall balance while ROC-AUC or PR curves focus on ranking/recall trade-offs.
Summary #
- MCC delivers a single, balanced view of classification performance from −1 to 1.
- In Python 3.13, compute it with matthews_corrcoef and visualise how it changes with the threshold.
- Report MCC alongside Accuracy, F1, and PR metrics to avoid misleading conclusions on imbalanced datasets.