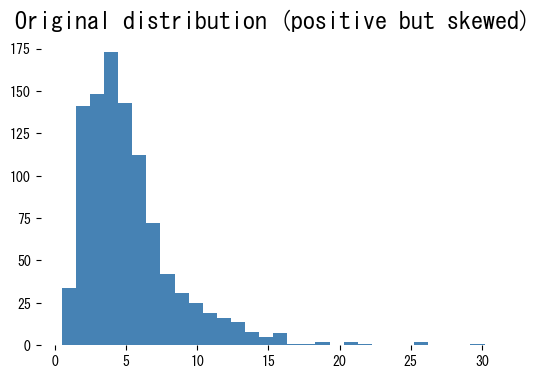
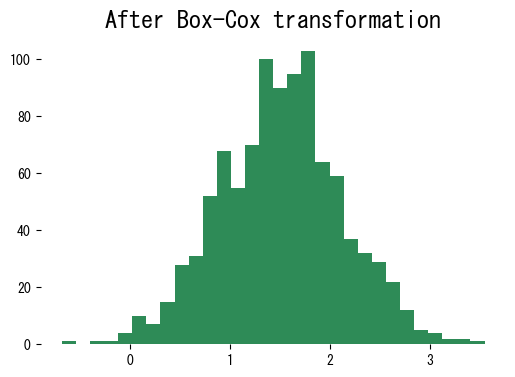
The Box-Cox transformation is a power transform that reduces skewness and stabilises variance under the assumption that all observations are strictly positive. When that condition is violated, consider shifting the data or switching to the Yeo-Johnson transformation.
Definition #
For an observation (x > 0) and power parameter (\lambda), the Box-Cox transform (T_\lambda(x)) is
$$ T_\lambda(x) = \begin{cases} \dfrac{x^\lambda - 1}{\lambda}, & \lambda \ne 0,\\ \log x, & \lambda = 0. \end{cases} $$
- (\lambda = 1) leaves the values unchanged, while (\lambda = 0) corresponds to the natural logarithm.
- The inverse transform is implemented as
scipy.special.inv_boxcox. - Maximum-likelihood estimation of (\lambda) is available via
scipy.stats.boxcox_normmax.
Because the expression involves (x^\lambda) and (\log x), all inputs must be strictly positive; add a small constant if necessary.
Worked example #
import numpy as np
import matplotlib.pyplot as plt

rng = np.random.default_rng(42)
x = rng.lognormal(mean=1.5, sigma=0.6, size=1_000)
plt.figure(figsize=(6, 4))
plt.hist(x, bins=30, color="steelblue")
plt.title("Original distribution (positive but skewed)")
plt.show()

from scipy.stats import boxcox, boxcox_normmax

lmbda = boxcox_normmax(x)  # maximum-likelihood estimate of lambda
print(f"Estimated lambda: {lmbda:.3f}")

x_trans = boxcox(x, lmbda=lmbda)
plt.figure(figsize=(6, 4))
plt.hist(x_trans, bins=30, color="seagreen")
plt.title("After Box-Cox transformation")
plt.show()

The transformed data are far closer to symmetric, making downstream linear models and distance-based algorithms easier to fit.
Practical tips #
- Fit (\lambda) on the training split only and reuse it for validation/test data to avoid leakage.
- Apply the inverse transform to predictions when you need to report results on the original scale.
- Combine Box-Cox with scaling (
StandardScaler) if the model expects zero-mean unit-variance inputs. - If the feature contains zeros or negatives, shift it by a constant or move to Yeo-Johnson, which is designed for signed data.