1
2
3
| import statsmodels.api as sm
import numpy as np
import matplotlib.pyplot as plt
|
Generate data for MA process
#
Prepare functions to generate data
 1
 2
 3
 4
 5
 6
 7
 8
 9
10
11
12
| def create_MAdata(thetas=[0.1], mu=1, N=400, init=1, c=1, sigma=0.3):
"""GGenerate MA Process data"""
epsilon = np.random.normal(loc=0, scale=sigma, size=N)
data = np.zeros(N)
data[0] = init
for t in range(2, N):
res = mu + epsilon[t]
for j, theta_j in enumerate(thetas):
res += theta_j * epsilon[t - j - 1]
data[t] = res
return data
|
MA(1)
#
1
2
3
4
5
| plt.figure(figsize=(12, 6))
thetas = [0.5]
ma1_1 = create_MAdata(thetas=thetas)
plt.plot(ma1_1)
plt.show()
|

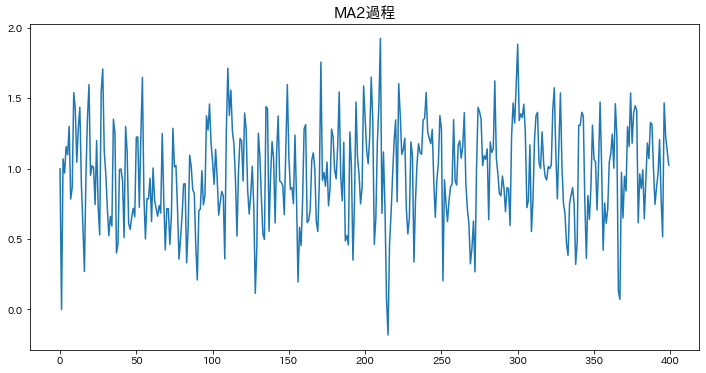
MA(2)
#
1
2
3
4
5
| plt.figure(figsize=(12, 6))
thetas = [0.5, 0.5]
ma1_2 = create_MAdata(thetas=thetas)
plt.plot(ma1_1)
plt.show()
|
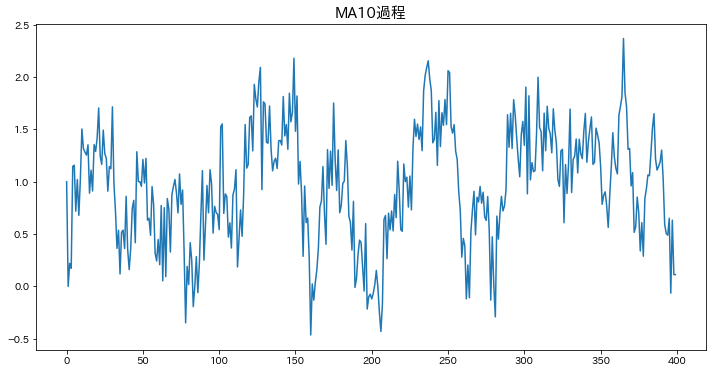
MA(5)
#
1
2
3
4
5
| plt.figure(figsize=(12, 6))
thetas = [0.5 for _ in range(10)]
ma1_5 = create_MAdata(thetas=thetas)
plt.plot(ma1_5)
plt.show()
|
- AR Process — Stochastic process depending on its own past values
- AR Process — understanding this concept first will make learning smoother