AR models are also known as autoregressive models.
As the name autoregressive implies, it refers to a stochastic process in which the output of the model at time t depends on its own output before time t.
1
2
3
import statsmodels.api as sm
import numpy as np
import matplotlib.pyplot as plt
Create data for AR process
# Prepare functions to generate data
 1
 2
 3
 4
 5
 6
 7
 8
 9
10
11
12
def create_ARdata ( phis = [ 0.1 ], N = 500 , init = 1 , c = 1 , sigma = 0.3 ):
"""Generating AR process data"""
print ( f "==AR( { len ( phis ) } ), #data= { N } ==" )
data = np . zeros ( N )
data [ 0 ] = init + np . random . normal ( 0 , sigma )
for t in range ( 2 , N ):
res = c + np . random . normal ( 0 , sigma )
for j , phi_j in enumerate ( phis ):
res += phi_j * data [ t - j - 1 ]
data [ t ] = res
return data
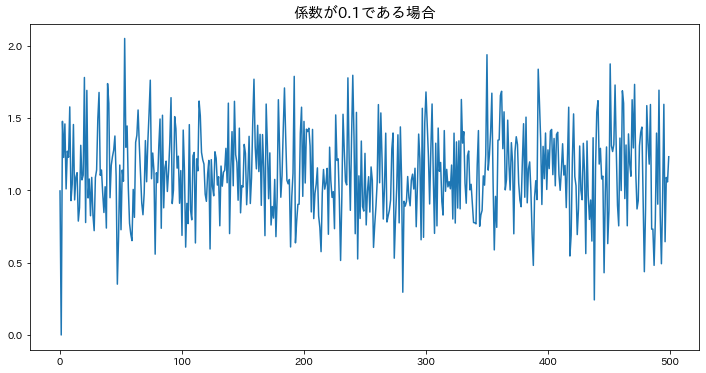
φ < 1
# 1
2
3
4
5
plt . figure ( figsize = ( 12 , 6 ))
phis = [ 0.1 ]
ar1_1 = create_ARdata ( phis = phis )
plt . plot ( ar1_1 )
plt . show ()
==AR(1), #data=500==
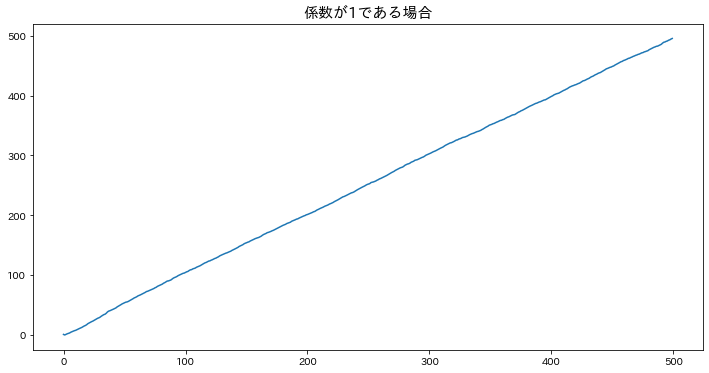
φ = 1
# 1
2
3
4
5
plt . figure ( figsize = ( 12 , 6 ))
phis = [ 1 ]
ar1_2 = create_ARdata ( phis = phis )
plt . plot ( ar1_2 )
plt . show ()
==AR(1), #data=500==
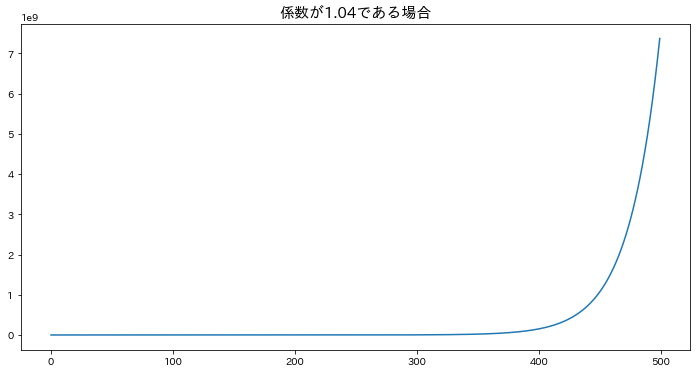
φ > 1
# 1
2
3
4
5
plt . figure ( figsize = ( 12 , 6 ))
phis = [ 1.04 ]
ar1_2 = create_ARdata ( phis = phis )
plt . plot ( ar1_2 )
plt . show ()
==AR(1), #data=500==
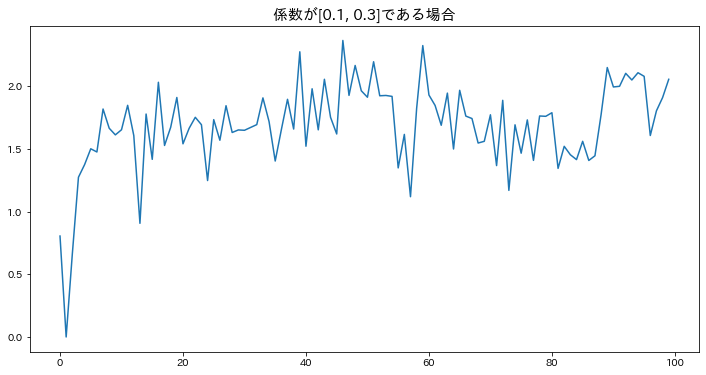
AR(2)
# 1
2
3
4
5
plt . figure ( figsize = ( 12 , 6 ))
phis = [ 0.1 , 0.3 ]
ar2_1 = create_ARdata ( phis = phis , N = 100 )
plt . plot ( ar2_1 )
plt . show ()
==AR(2), #data=100==
1
2
3
4
5
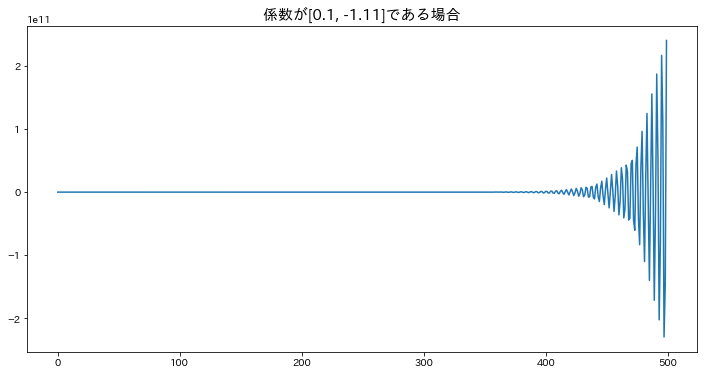
plt . figure ( figsize = ( 12 , 6 ))
phis = [ 0.1 , - 1.11 ]
ar2_1 = create_ARdata ( phis = phis )
plt . plot ( ar2_1 )
plt . show ()
==AR(2), #data=500==
Estimate the autoregressive (AR) model
# 1
2
3
4
5
6
from statsmodels.tsa.ar_model import AutoReg
res = AutoReg ( ar1_1 , lags = 1 ) . fit ()
out = "AIC: {0:0.3f} , HQIC: {1:0.3f} , BIC: {2:0.3f} "
print ( out . format ( res . aic , res . hqic , res . bic ))
AIC: 231.486, HQIC: 236.445, BIC: 244.124
1
2
3
print ( res . params )
print ( res . sigma2 )
res . summary ()
[1.03832755 0.07236388]
0.09199676371696269
AutoReg Model Results Dep. Variable: y No. Observations: 500 Model: AutoReg(1) Log Likelihood -112.743 Method: Conditional MLE S.D. of innovations 0.303 Date: Sat, 13 Aug 2022 AIC 231.486 Time: 01:55:17 BIC 244.124 Sample: 1 HQIC 236.445 500
coef std err z P>|z| [0.025 0.975] const 1.0383 0.052 20.059 0.000 0.937 1.140 y.L1 0.0724 0.045 1.621 0.105 -0.015 0.160
Roots Real Imaginary Modulus Frequency AR.1 13.8190 +0.0000j 13.8190 0.0000
MA Process — Stochastic process expressing current value as a linear combination of errors