5.10.5
Adjustment
Sometimes data affected by the value of money need to be adjusted before analysis. Here we will use the Consumer Price Index (CPI) to adjust time series data for inflation. Specifically, in this page, I’ll try to…
- Obtain CPI data from FRED using the python API
- Obtain median household income data for the U.S.
- Adjust the U.S. median household income data using the CPI
- Compare the median household income data (adjusted) in the U.S. with the data adjusted using the CPI.
| |
Get data from FRED #
Obtain the necessary data from FRED. The method of data acquisition is explained in a separate video, but it is necessary to issue an API key to access the data from python.
| |
FRED API key is set to an environment variable:True
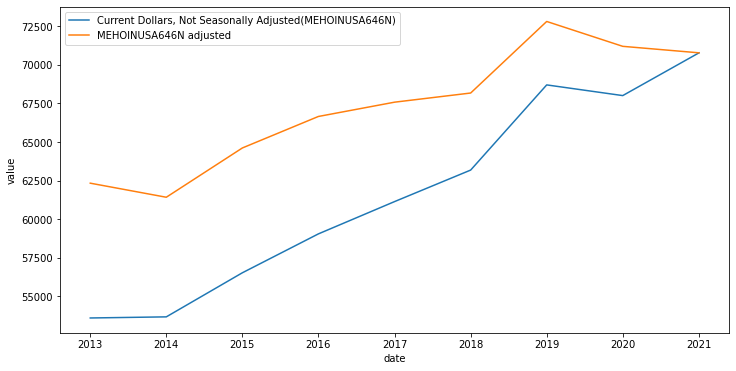
Household Income in the United States #
Let’s check the data for Median Household Income in the United States (MEHOINUSA646N). This data is in units of
Units: Current Dollars, Not Seasonally Adjusted
and this data is not adjusted for inflation or seasonally adjusted. We adjust this household data using the inflation rate.
| |
| value | |
|---|---|
| date | |
| 2013-01-01 | 53585 |
| 2014-01-01 | 53657 |
| 2015-01-01 | 56516 |
| 2016-01-01 | 59039 |
| 2017-01-01 | 61136 |
Adjust values using CPI #
| |
Comparison before and after adjustment #
| |
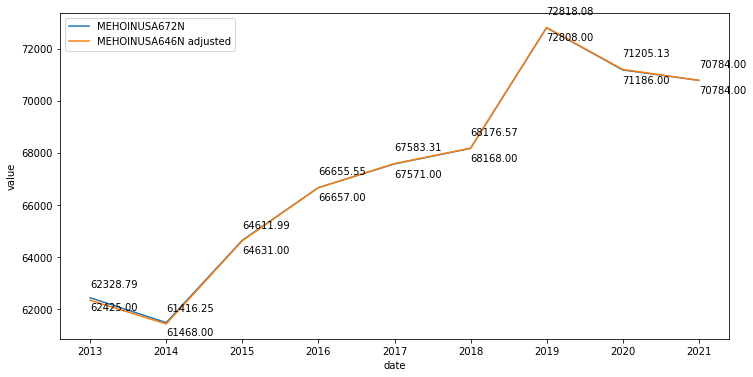
Real Median Household Income in the United States #
Adjusted data are provided in Real Median Household Income in the United States (MEHOINUSA672N). Compare the values in MEHOINUSA672N with the inflation-adjusted data (values in the adjusted column in the data) from earlier. The unadjusted values, adjusted using the Consumer Price Index (CPI), are expected to match the adjusted values (MEHOINUSA672N) almost exactly.
| |
| value | |
|---|---|
| date | |
| 2013-01-01 | 62425 |
| 2014-01-01 | 61468 |
| 2015-01-01 | 64631 |
| 2016-01-01 | 66657 |
| 2017-01-01 | 67571 |
| |
- Box-Cox / Yeo-Johnson Transforms — Normalize skewed distributions via transformation