1
2
3
4
5
6
7
8
9
import numpy as np
import matplotlib.pyplot as plt
import seaborn as sns
from dtaidistance import dtw
from dtaidistance import dtw_visualisation as dtwvis
from utils import DDTW
np . random . seed ( 777 )
 1
 2
 3
 4
 5
 6
 7
 8
 9
10
data1 = np . array ([ 12.0 * np . sin ( i / 2.1 ) + 20 for i in range ( 30 )])
data2 = np . array ([ 10.0 * np . sin ( i / 2.0 ) + np . random . rand () for i in range ( 30 )])
plt . figure ( figsize = ( 12 , 4 ))
# Plotting the waveforms
plt . plot ( data1 , label = "data1" , color = "k" )
plt . plot ( data2 , label = "data2" , color = "r" )
plt . legend ()
plt . show ()
DTW
# 1
2
3
4
5
6
7
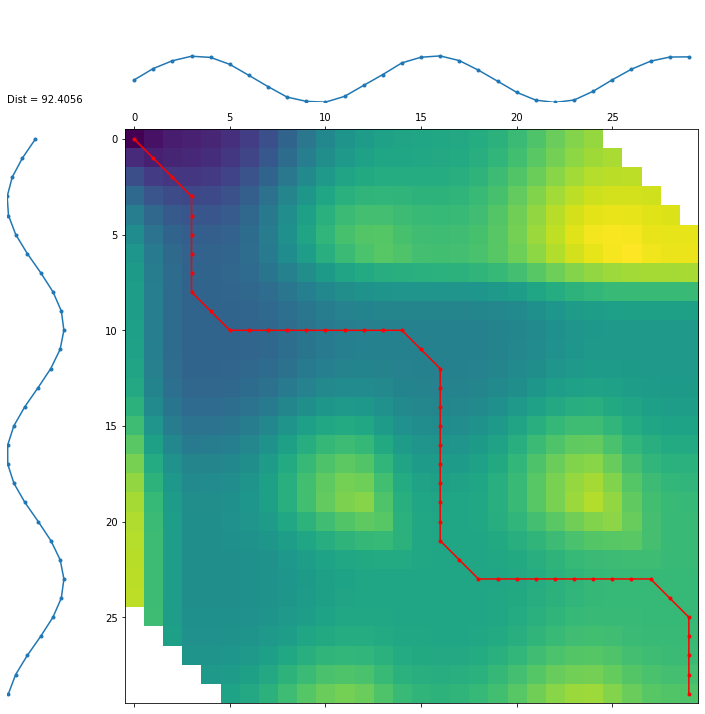
d , paths = dtw . warping_paths (
data1 ,
data2 ,
window = 25 ,
)
best_path = dtw . best_path ( paths )
dtwvis . plot_warpingpaths ( data1 , data2 , paths , best_path )
DDTW
# 1
2
3
4
5
6
7
8
9
10
11
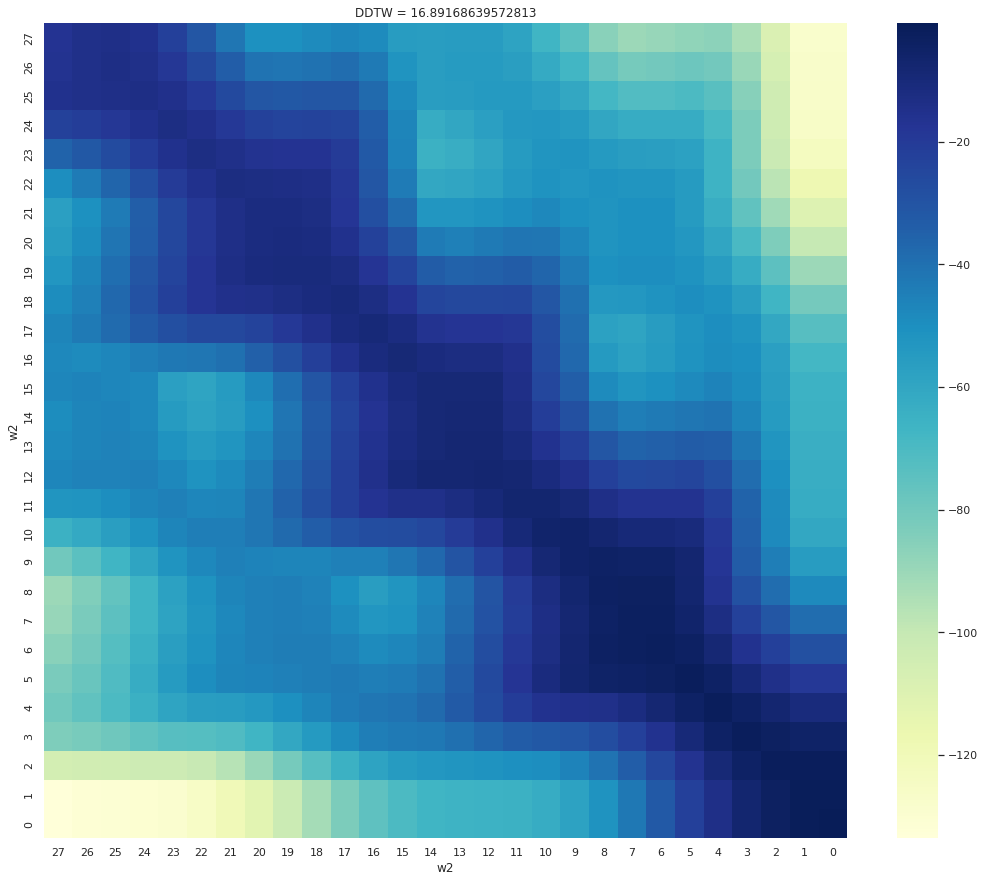
γ_mat , arrows , ddtw = DDTW ( np . array ( data1 ), np . array ( data2 ))
sns . set ( rc = { "figure.figsize" : ( 18 , 15 )})
sns . set ( font = "IPAexGothic" )
ax = sns . heatmap ( - 1 * γ_mat , cmap = "YlGnBu" )
ax . set_title ( f "DDTW = { ddtw } " )
ax . invert_xaxis ()
ax . invert_yaxis ()
ax . set_xlabel ( "w2" )
ax . set_ylabel ( "w2" )
plt . show ()
Learning navigator
PHASE 4 · Applications
Mark pages as read to see your progress on the home page and section lists (stored only in your browser).