Advanced Visualizations

Visualize

Advanced Visualizations

Advanced Visualizations #

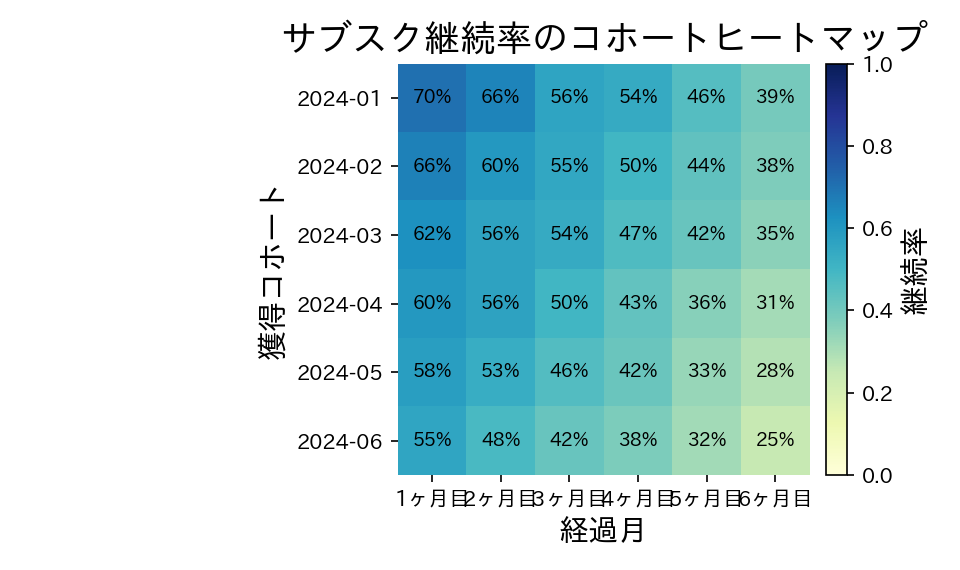
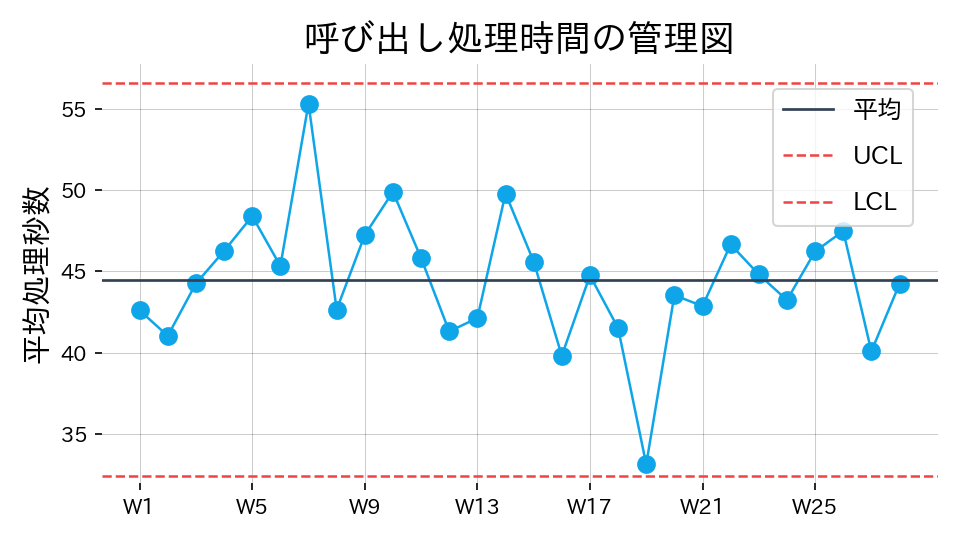
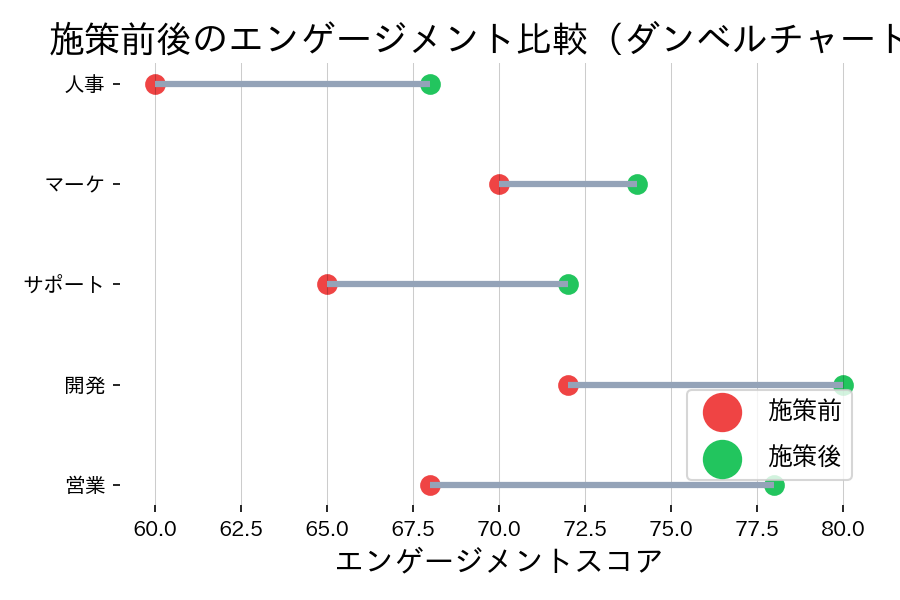
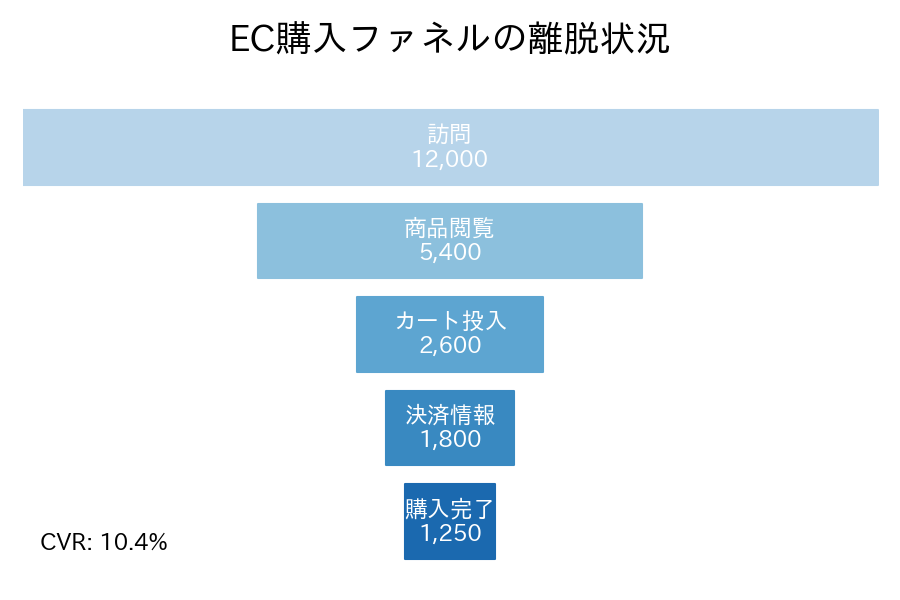
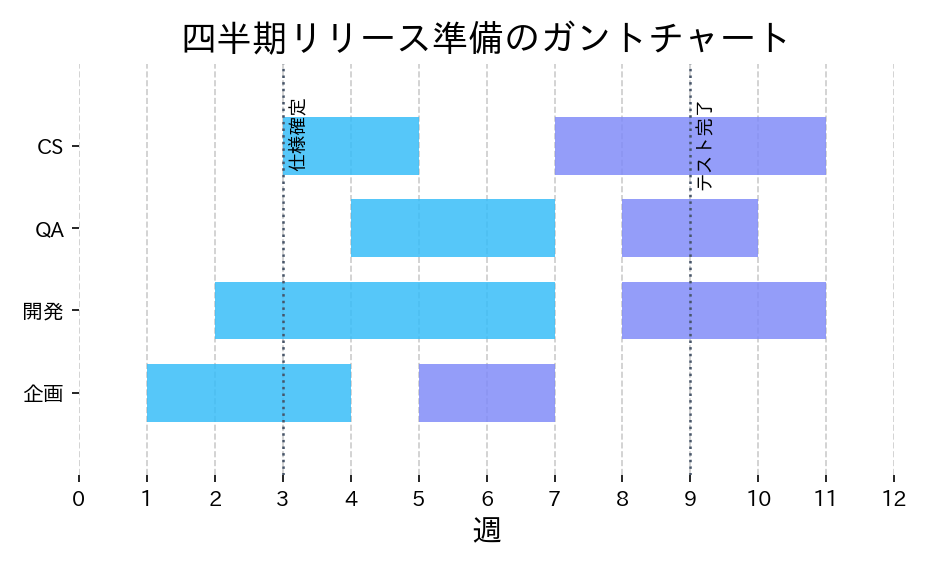
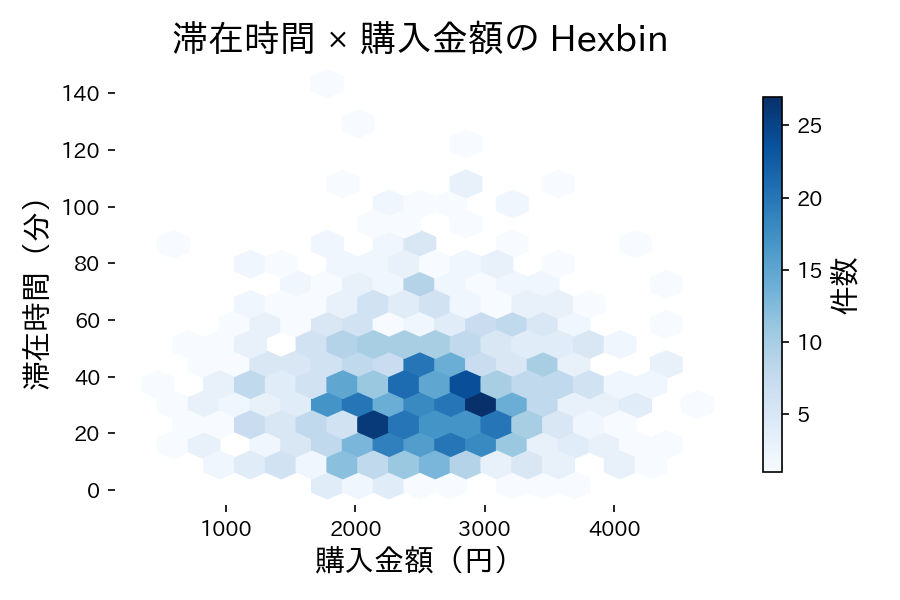
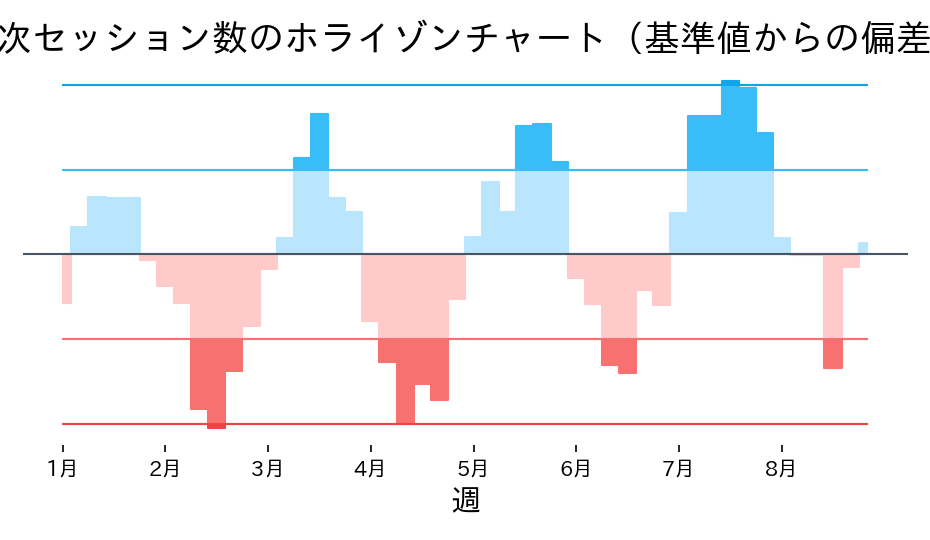
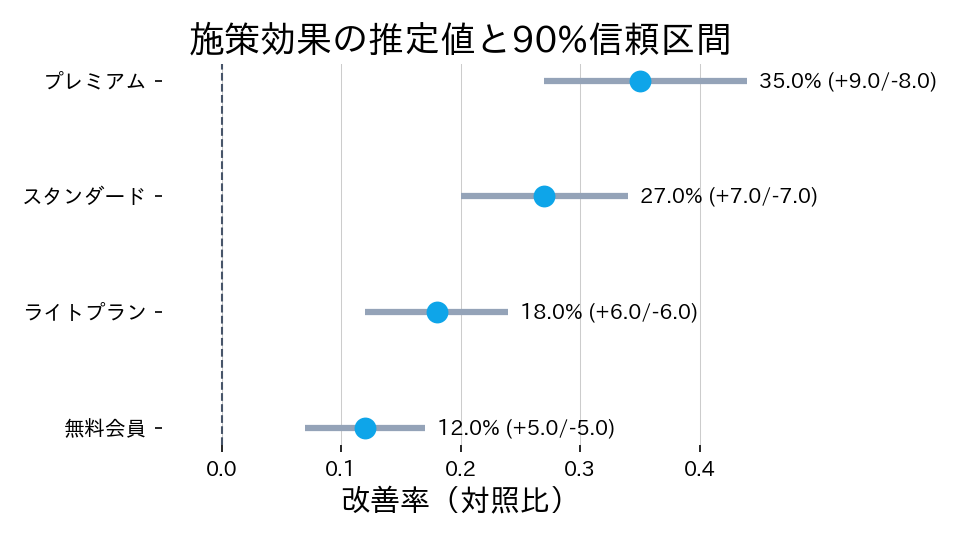
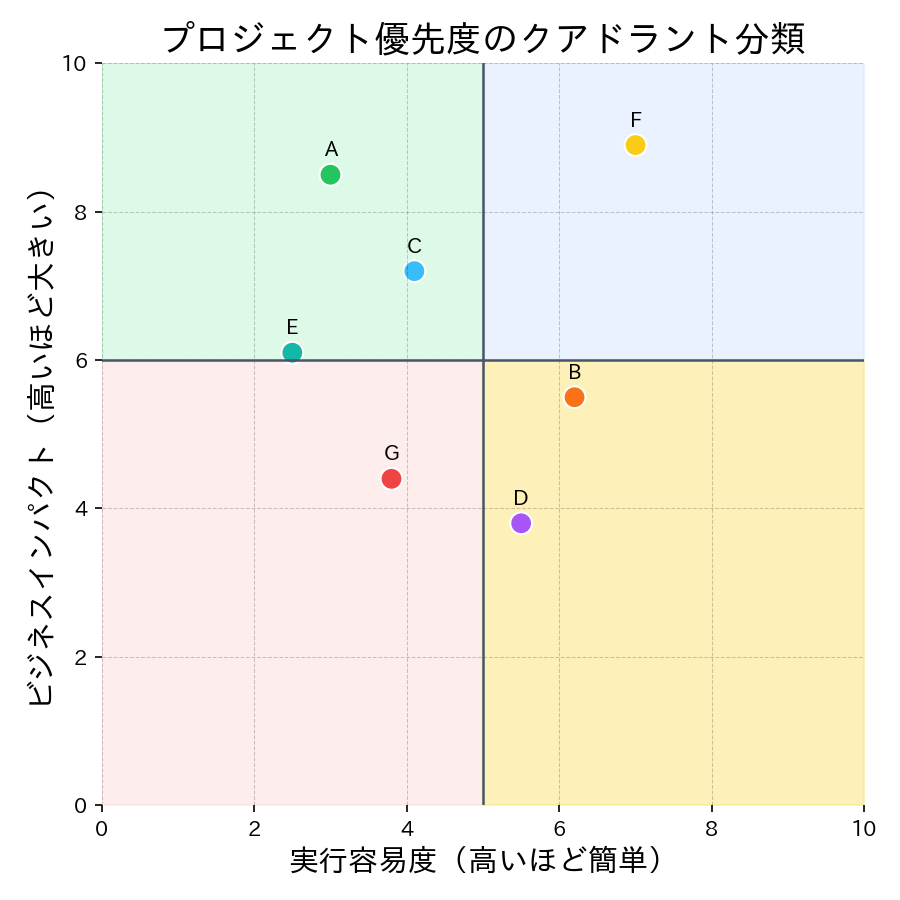
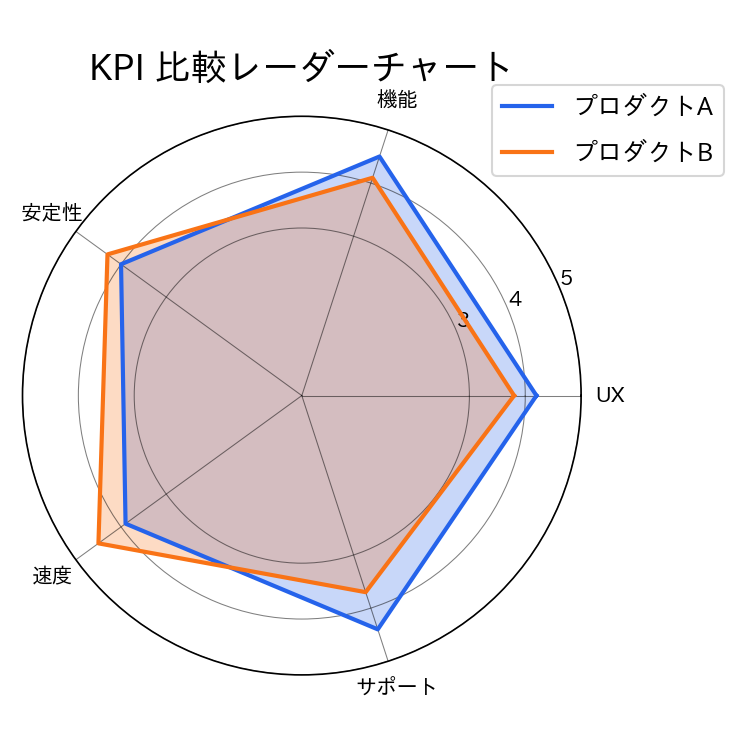
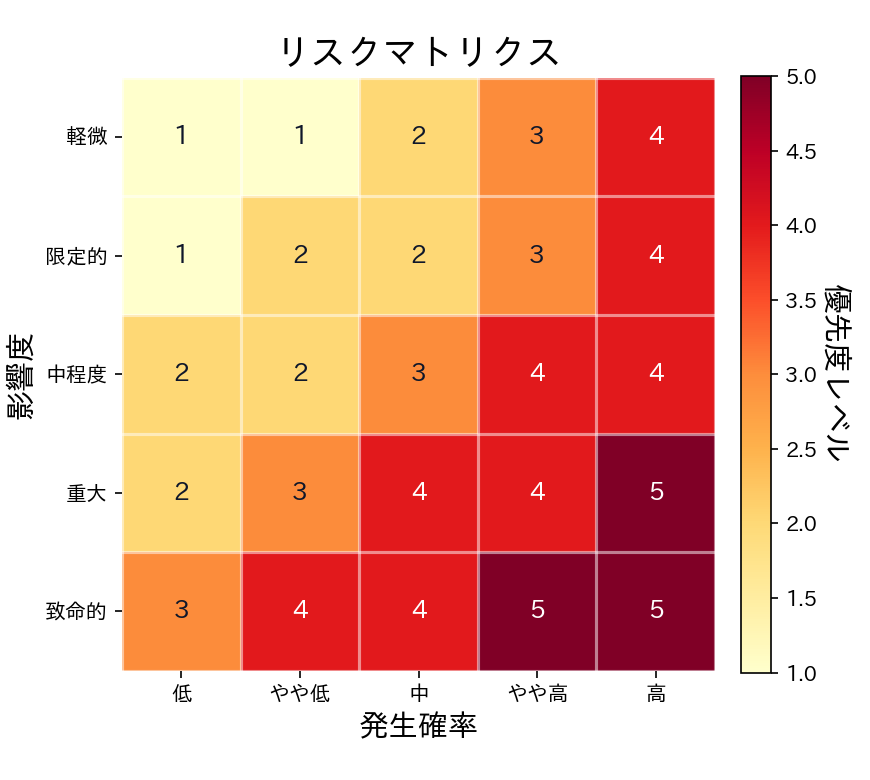
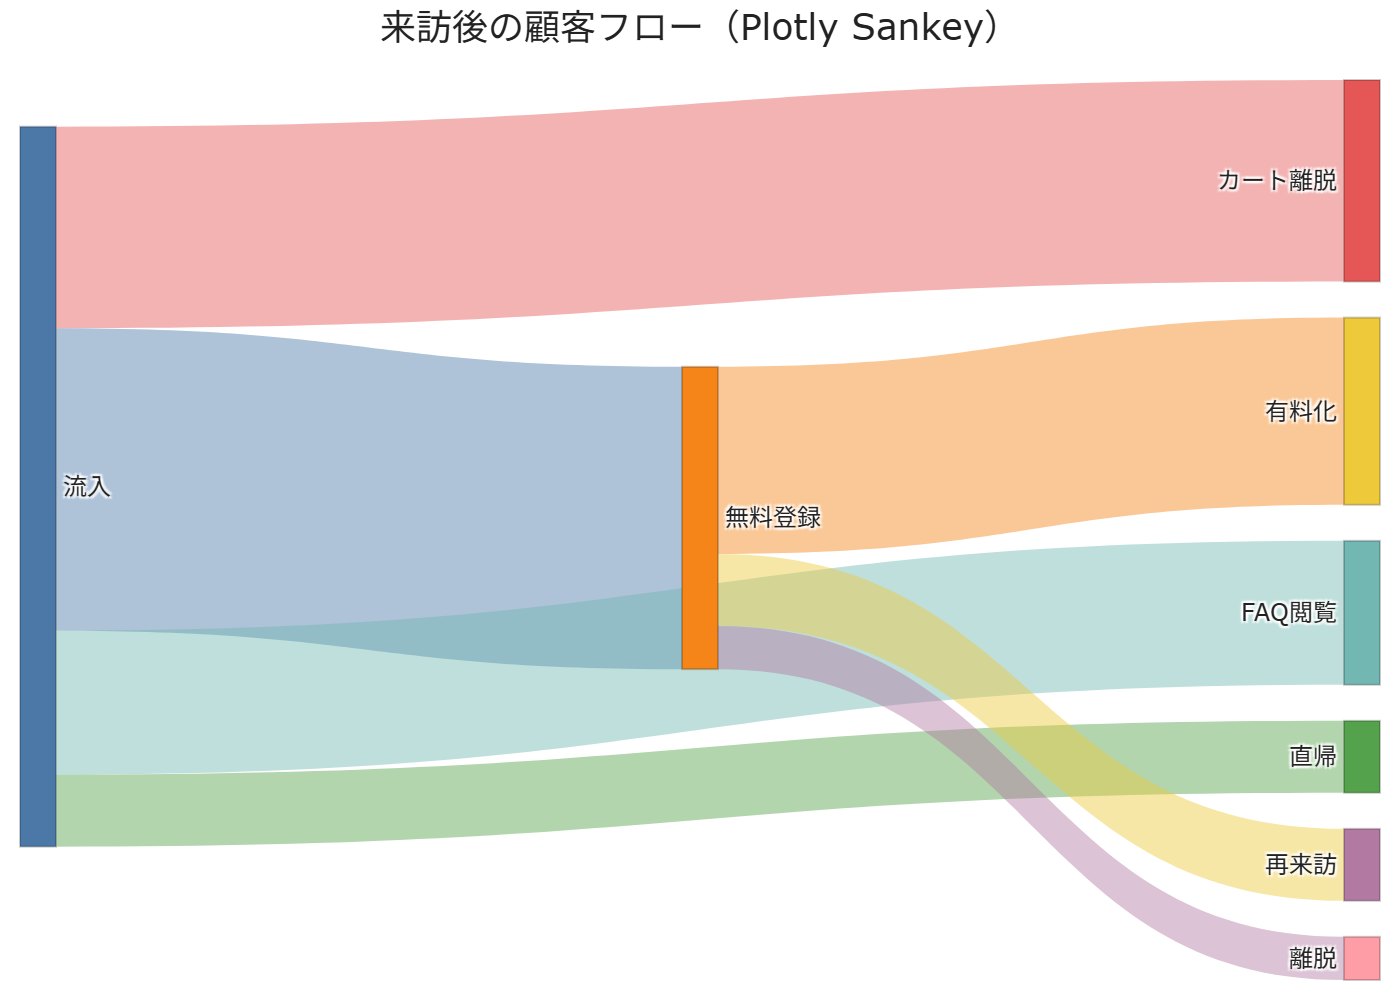
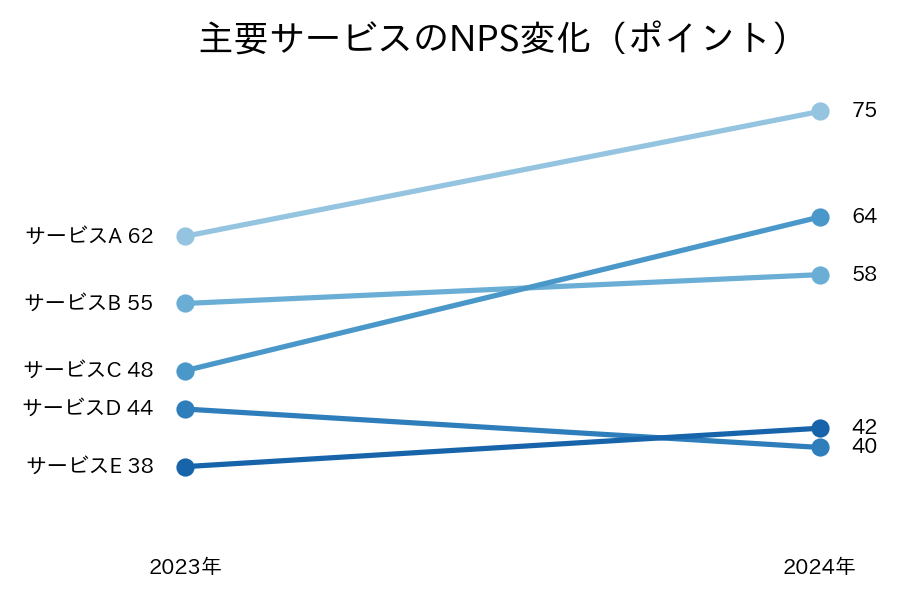
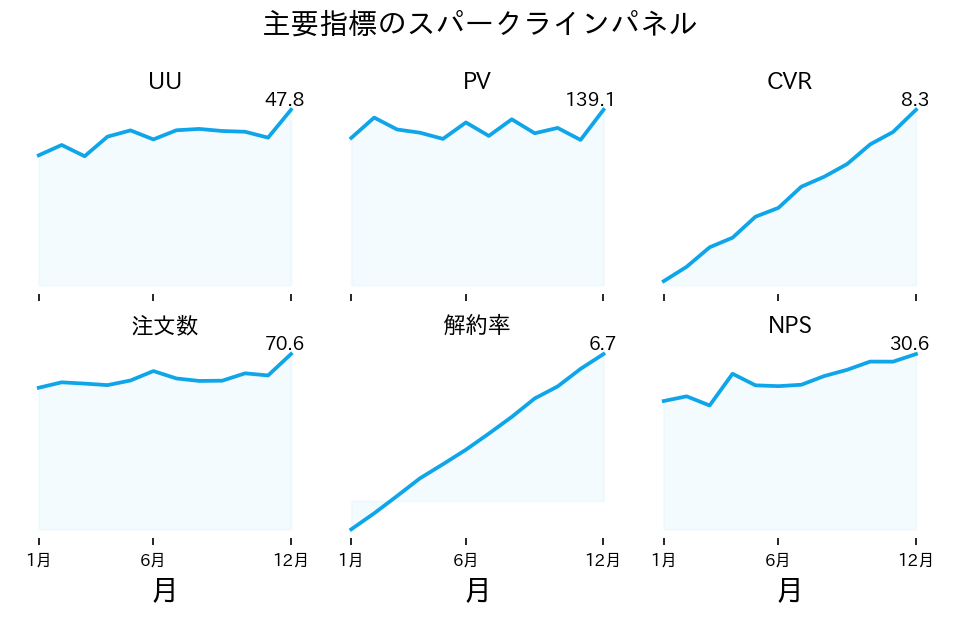
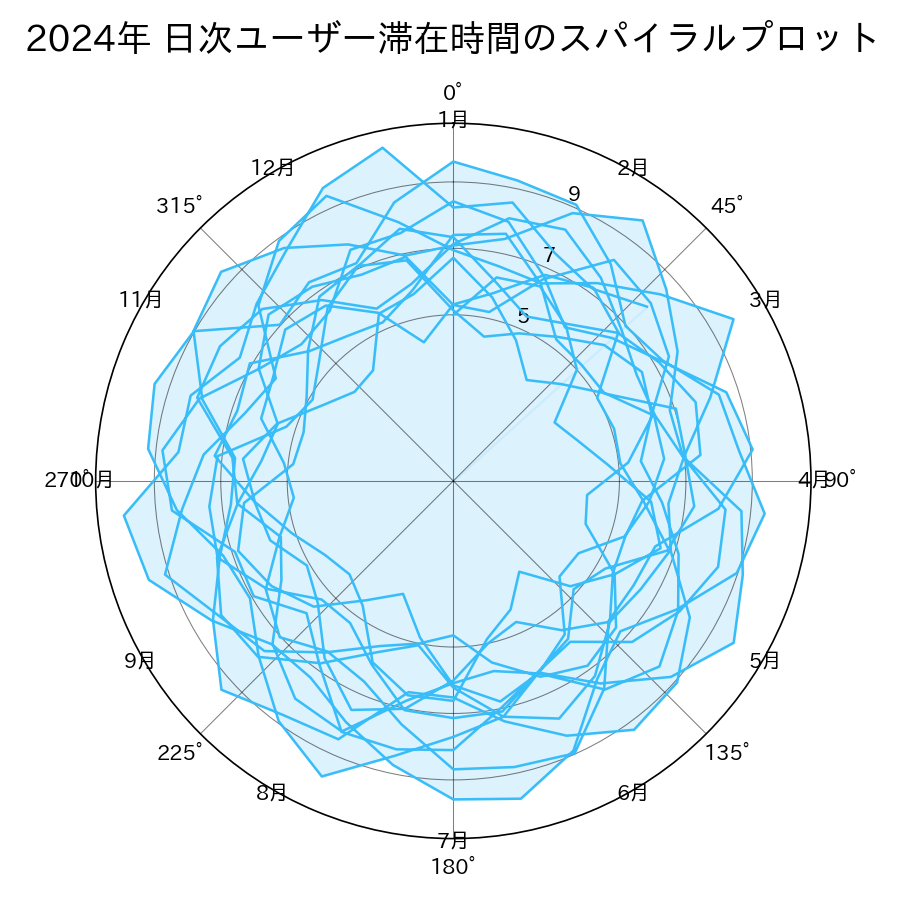
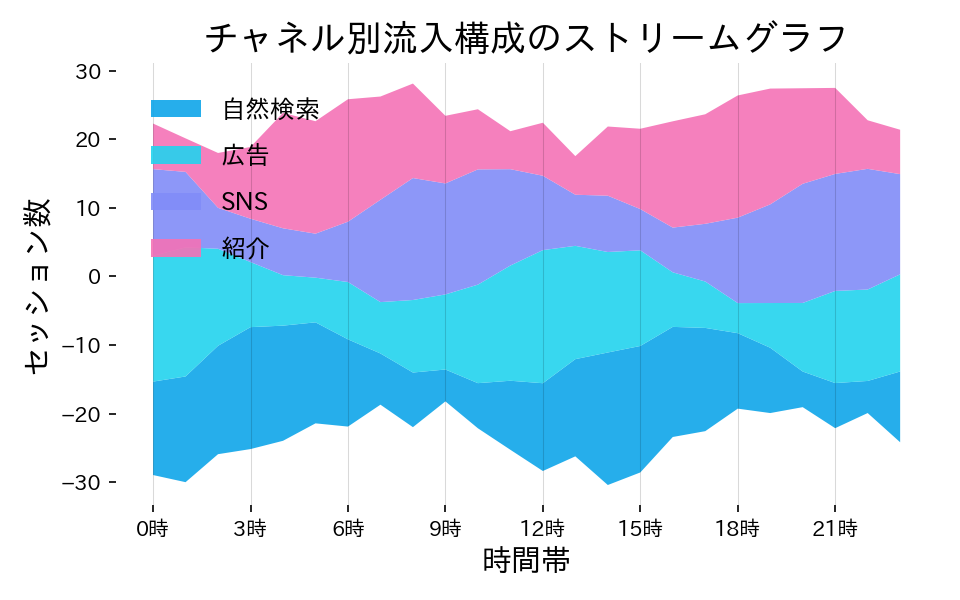
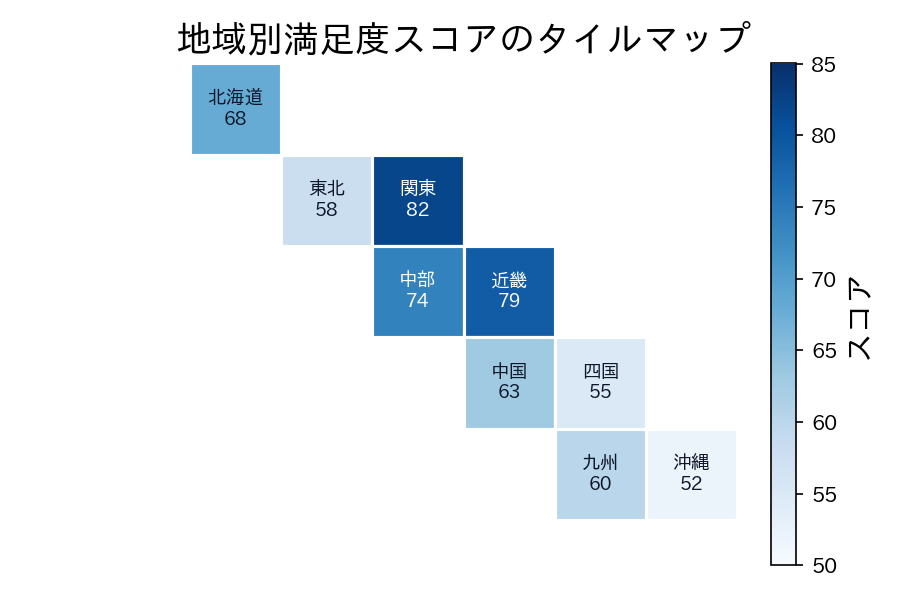
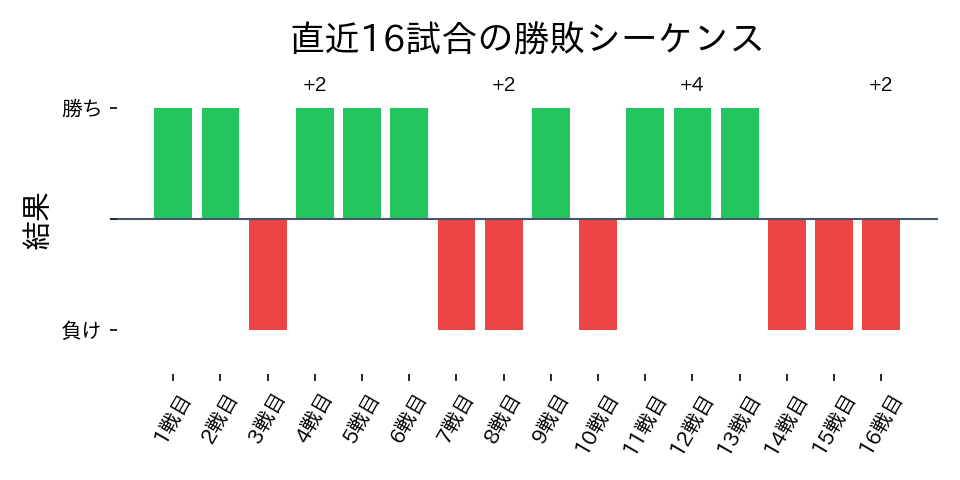
These charts help you grasp complex metrics and multi-dimensional relationships at once. Choose the best fit for your business needs and data characteristics from the gallery below.

Barcode timeline
Barcode timeline
Bump chart
Bump chart
Bullet chart
Bullet chart
Calendar heatmap
Calendar heatmap
Cohort heatmap
Cohort heatmap
Control chart
Control chart
Dumbbell chart
Dumbbell chart
Funnel chart
Funnel chart
Gantt chart
Gantt chart
Hexbin plot
Hexbin plot
Horizon chart
Horizon chart
Interval dot plot
Interval dot plot
Lag scatter
Lag scatter
Pareto chart
Pareto chart
Polar area chart
Polar area chart
Population pyramid
Population pyramid
Quadrant chart
Quadrant chart
Radar chart
Radar chart
Risk matrix
Risk matrix
Sankey diagram
Sankey diagram
Slopegraph
Slopegraph
Sparkline panel
Sparkline panel
Spiral plot
Spiral plot
Streamgraph
Streamgraph
Tilemap
Tilemap
Win/loss chart
Win/loss chart