6.1.1
Map of Japan
- japanmap
- SaitoTsutomu/japanmap
- Visualization of data by prefecture (page with library author’s explanation of usage)
This package is useful for creating heat maps, etc. with Japanese maps. It should run on python 3.9 or higher version.
Display map of Japan #
| |
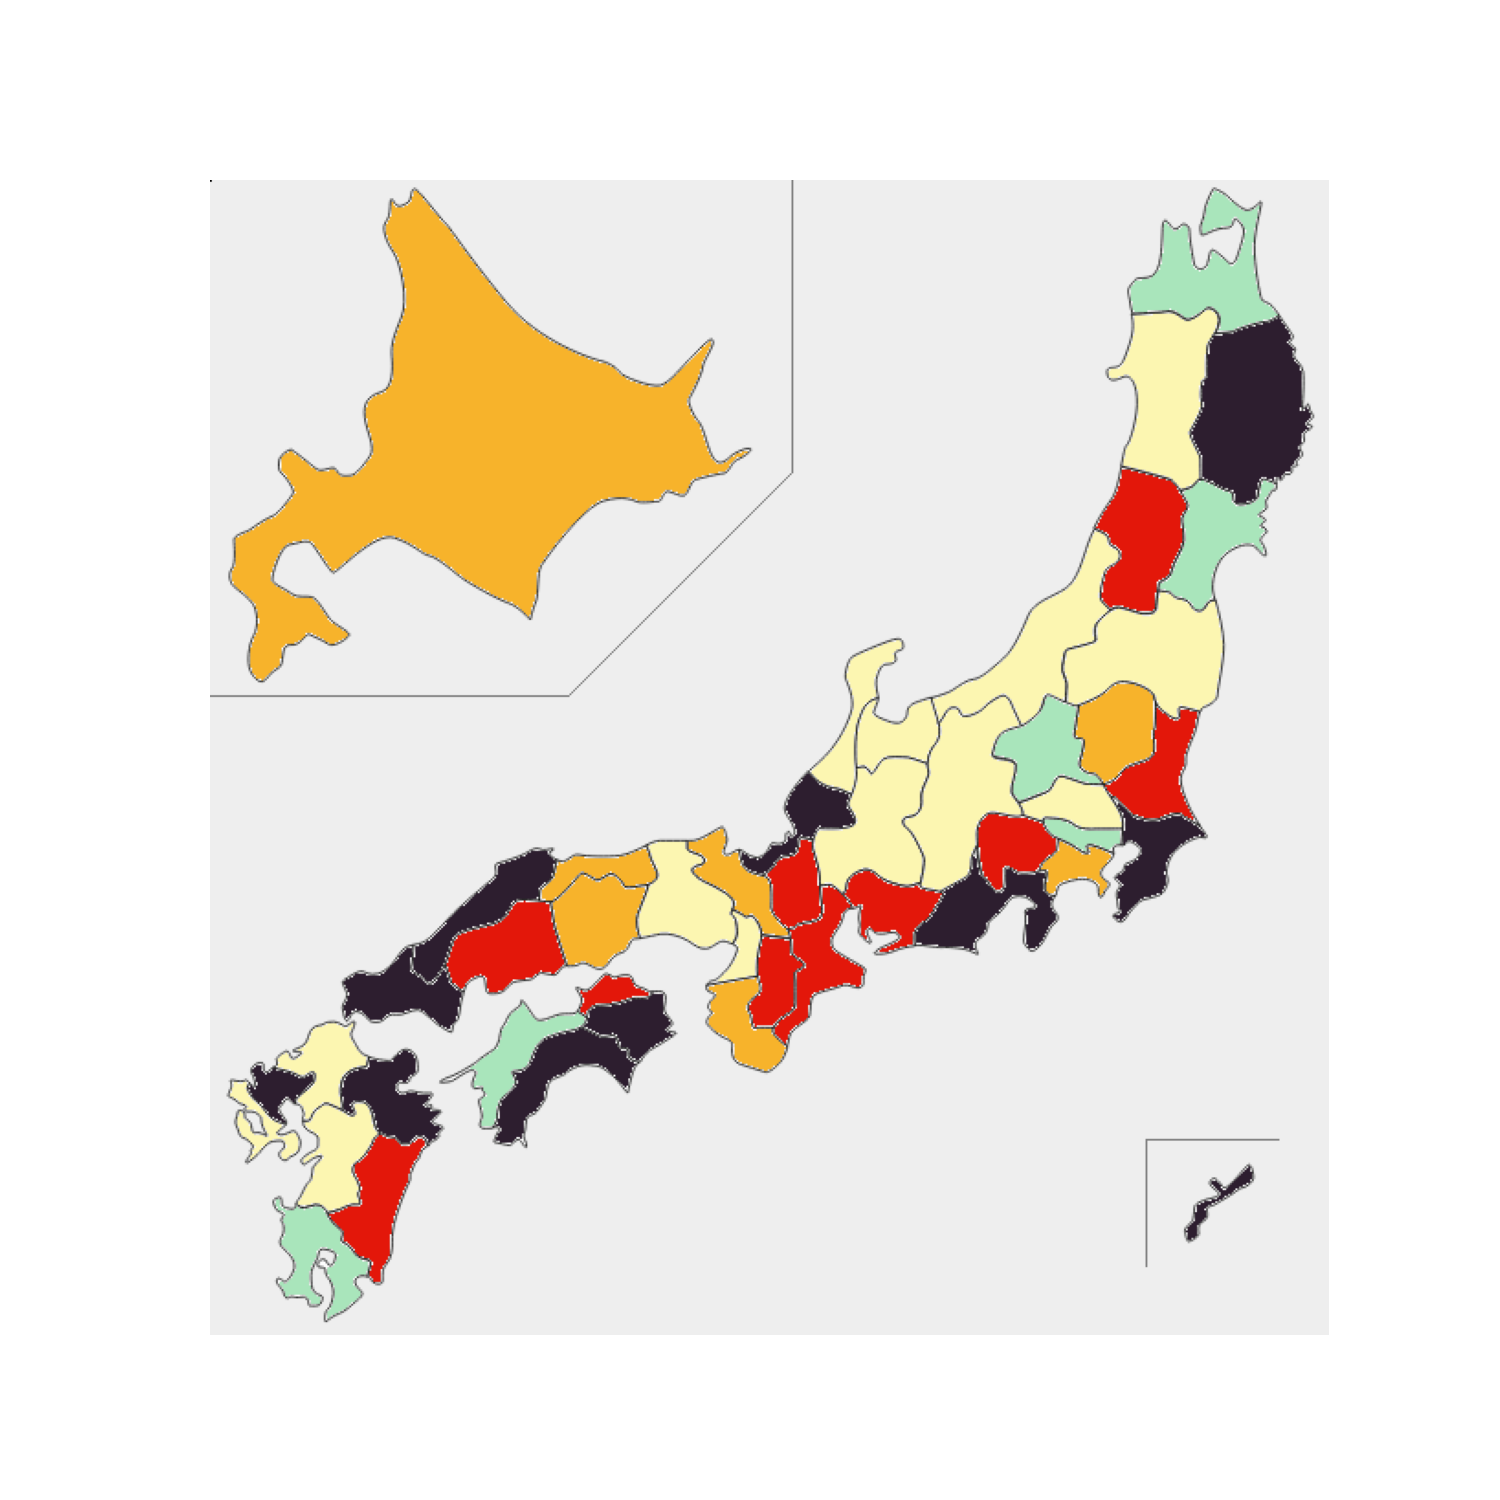
Colorize japan map #
For example, you can color a map of Japan by preparing the following dictionary with prefecture names as key and color names as value.
{'北海道': '#a9e5bb', '青森': '#fcf6b1', '沖縄': '#fcf6b1'}
| |
入力:{'北海道': '#2d1e2f', '青森': '#2d1e2f', '岩手': '#f7b32b', '宮城': '#e3170a', '秋田': '#e3170a', '山形': '#a9e5bb', '福島': '#2d1e2f', '茨城': '#f7b32b', '栃木': '#e3170a', '群馬': '#f7b32b', '埼玉': '#2d1e2f', '千葉': '#2d1e2f', '東京': '#fcf6b1', '神奈川': '#f7b32b', '新潟': '#f7b32b', '富山': '#a9e5bb', '石川': '#f7b32b', '福井': '#a9e5bb', '山梨': '#a9e5bb', '長野': '#2d1e2f', '岐阜': '#e3170a', '静岡': '#2d1e2f', '愛知': '#a9e5bb', '三重': '#e3170a', '滋賀': '#a9e5bb', '京都': '#fcf6b1', '大阪': '#f7b32b', '兵庫': '#2d1e2f', '奈良': '#f7b32b', '和歌山': '#a9e5bb', '鳥取': '#2d1e2f', '島根': '#e3170a', '岡山': '#2d1e2f', '広島': '#e3170a', '山口': '#a9e5bb', '徳島': '#f7b32b', '香川': '#2d1e2f', '愛媛': '#f7b32b', '高知': '#fcf6b1', '福岡': '#2d1e2f', '佐賀': '#2d1e2f', '長崎': '#2d1e2f', '熊本': '#fcf6b1', '大分': '#a9e5bb', '宮崎': '#fcf6b1', '鹿児島': '#a9e5bb', '沖縄': '#2d1e2f'}
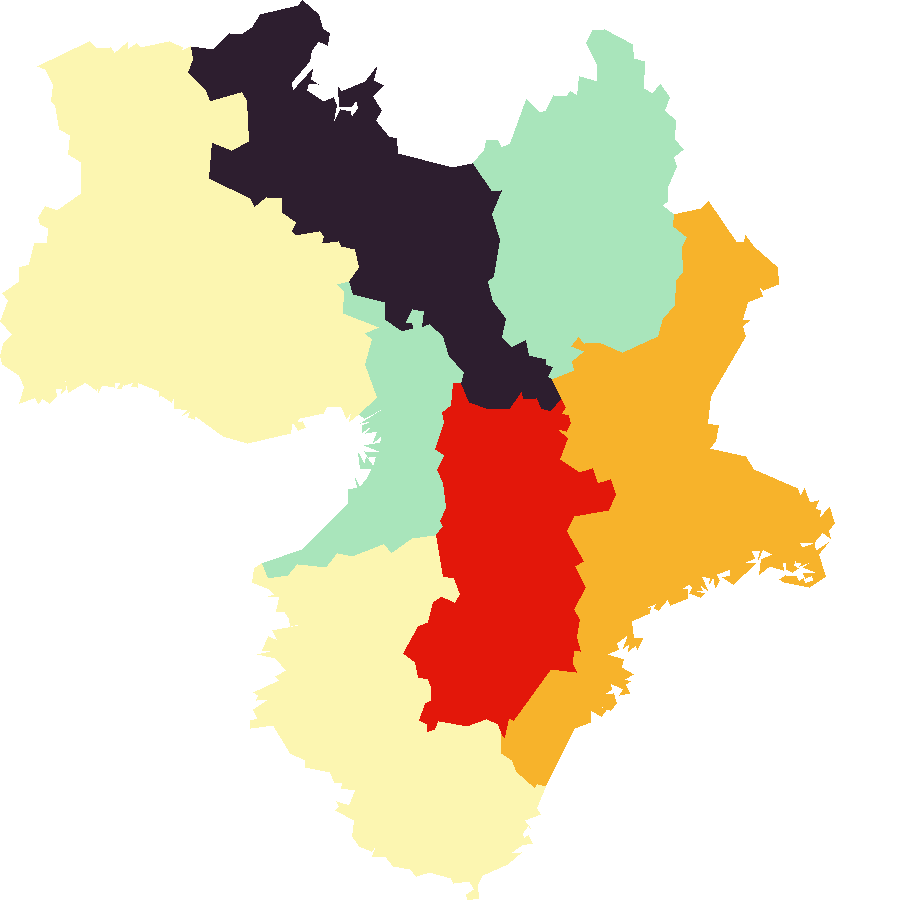
Zoom in on a specific region only #
You can also zoom in on a specific region of Japan (e.g. Kanto, Kansai, etc.).
| |
groups: {'北海道': [1], '東北': [2, 3, 4, 5, 6, 7], '関東': [8, 9, 10, 11, 12, 13, 14], '中部': [15, 16, 17, 18, 19, 20, 21, 22, 23], '近畿': [24, 25, 26, 27, 28, 29, 30], '中国': [31, 32, 33, 34, 35], '四国': [36, 37, 38, 39], '九州': [40, 41, 42, 43, 44, 45, 46, 47]}
![groups: {‘北海道’: [1], ‘東北’: [2, 3, 4, 5, 6, 7], ‘関東’: 8, 9,… figure
- Calendar Heatmap — Overview daily metrics across a year by weekday × week