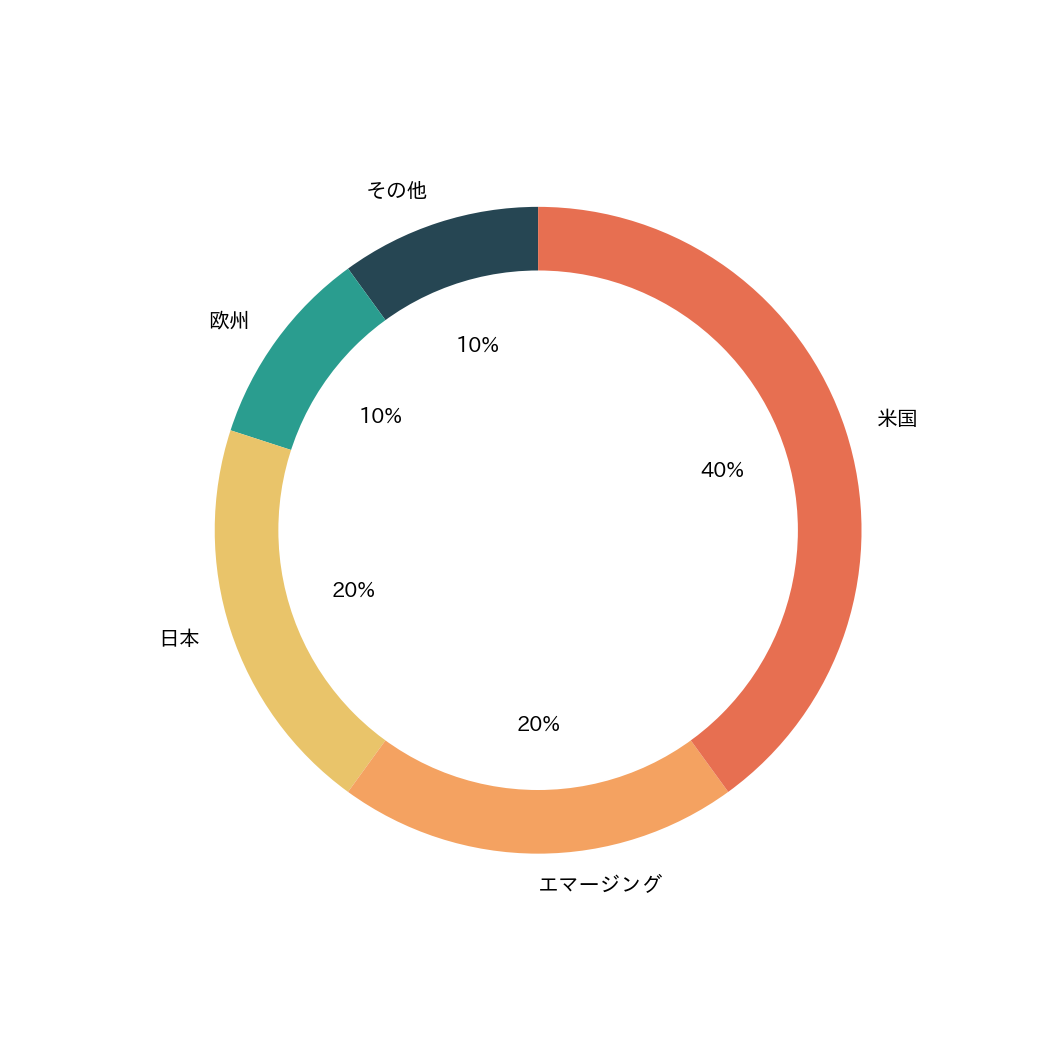
A doughnut chart (doughnut graph) is a type of pie chart used to display ratios by category, with a blank space in the middle. The blank space has no special meaning, but it can be used to display overall statistics (e.g., “Total XXX yen”). Donut charts are created in python using matplotlib.pyplot.pie.
 1
 2
 3
 4
 5
 6
 7
 8
 9
10
11
12
13
14
15
16
17
18
19
20
21
| import matplotlib.pyplot as plt
# Data
percent = [40, 20, 20, 10, 10]
explode = [0, 0, 0, 0, 0]
labels = ["米国", "エマージング", "日本", "欧州", "その他"]
percent.reverse()
explode.reverse()
labels.reverse()
# Create pie chart
plt.figure(figsize=(7, 7))
plt.pie(x=percent, labels=labels, explode=explode, autopct="%1.0f%%", startangle=90)
# Add a blank circle in the middle
background_color = "#fff"
p = plt.gcf()
p.gca().add_artist(plt.Circle((0, 0), 0.8, color=background_color))
plt.show()
|
- Treemap — Compare hierarchical values by area