Distribution
title: “Distributions | Histograms, Density, and Spread” weight: 2 created: 2019-02-19T16:22:48+09:00 lastmod: 2025-11-05T00:00:00+09:00 chapter: true not_use_colab: true not_use_twitter: true pre: “6.2 ” header_image: “/images/bg/france2.jpg” #
Distributions #
A gallery of charts to understand probability distributions, outliers, and density. Pick what you need from the options below.
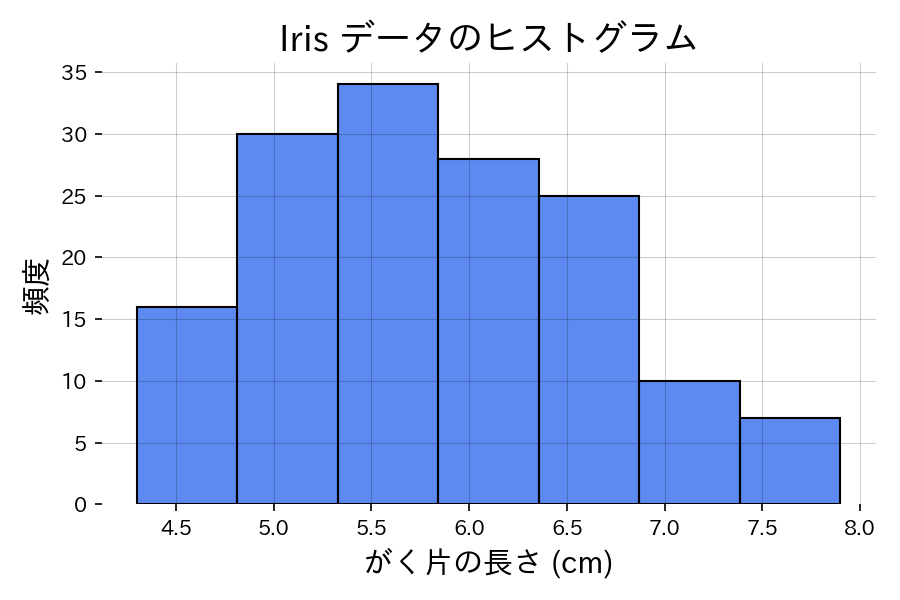 Histogram | 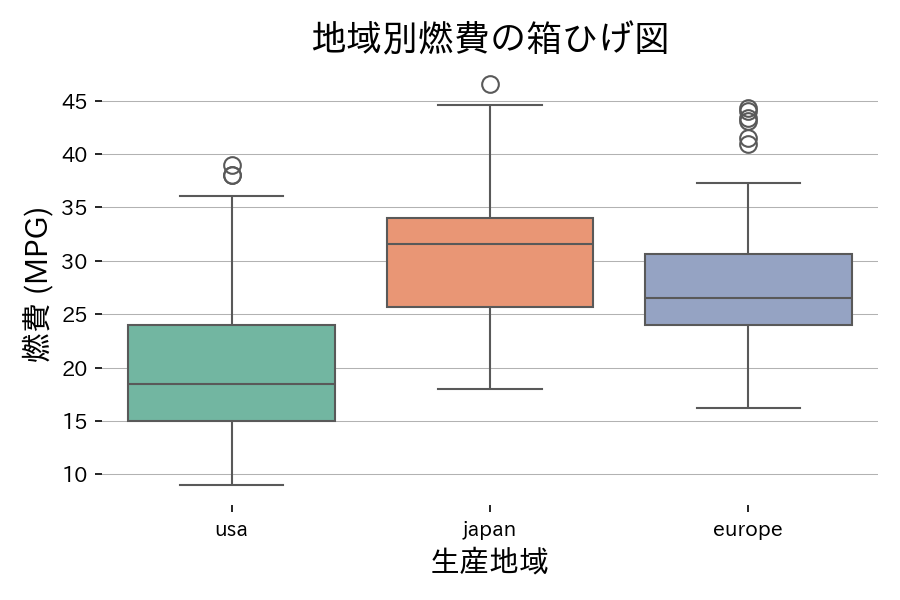 Boxplot | 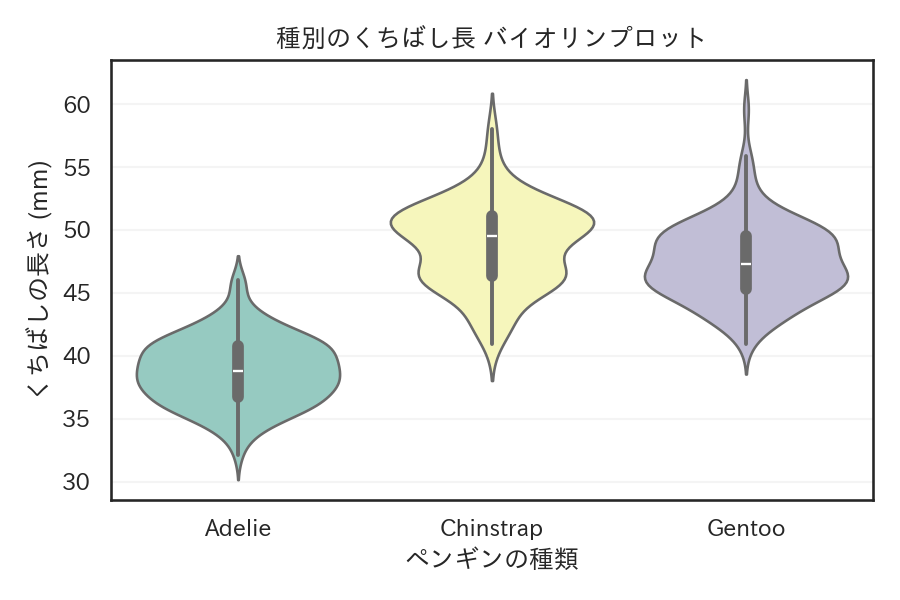 Violin Plot |
|---|---|---|
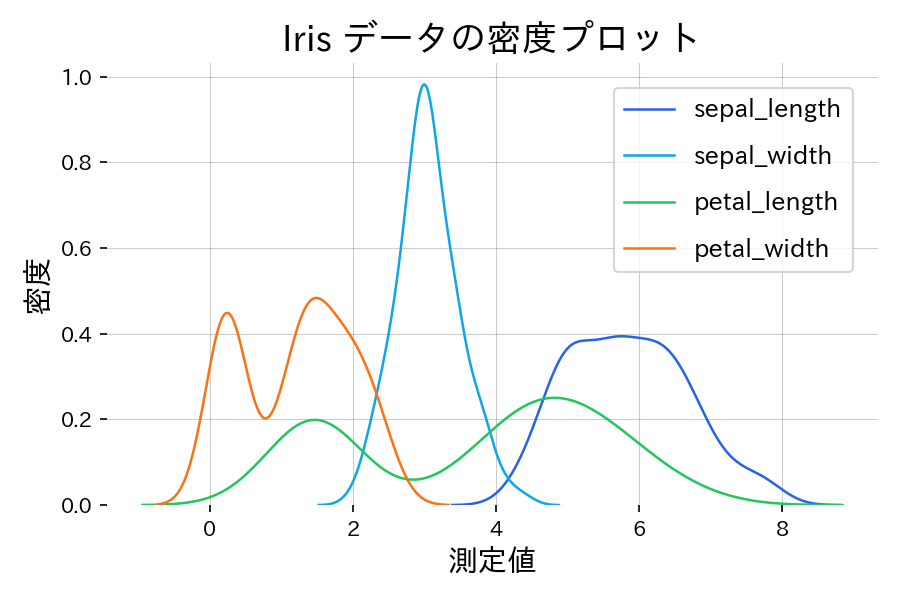 KDE (Density Plot) | 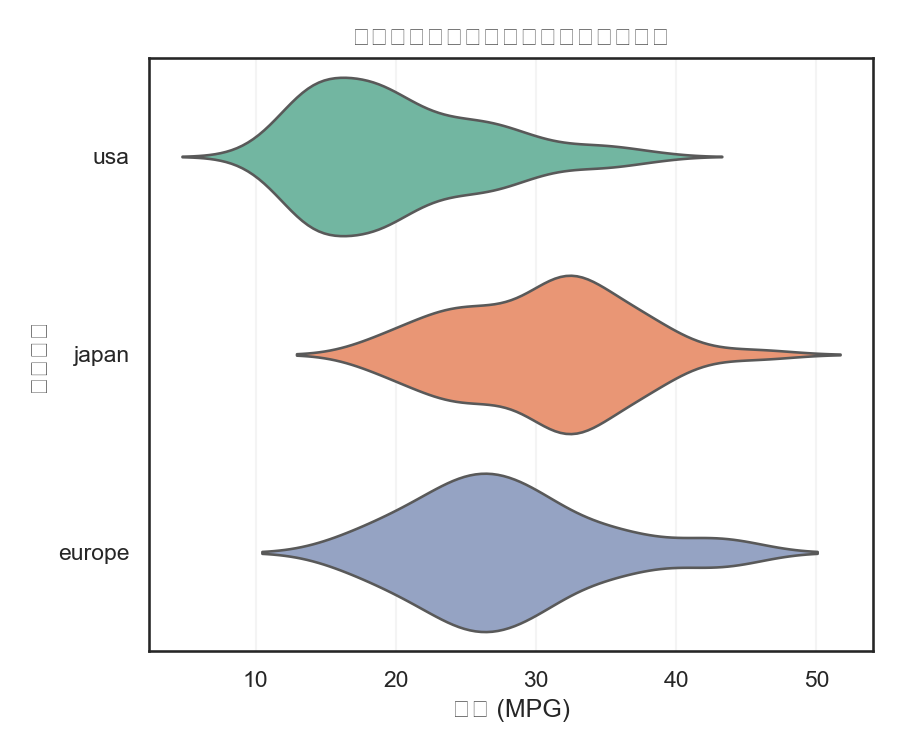 Ridgeline | 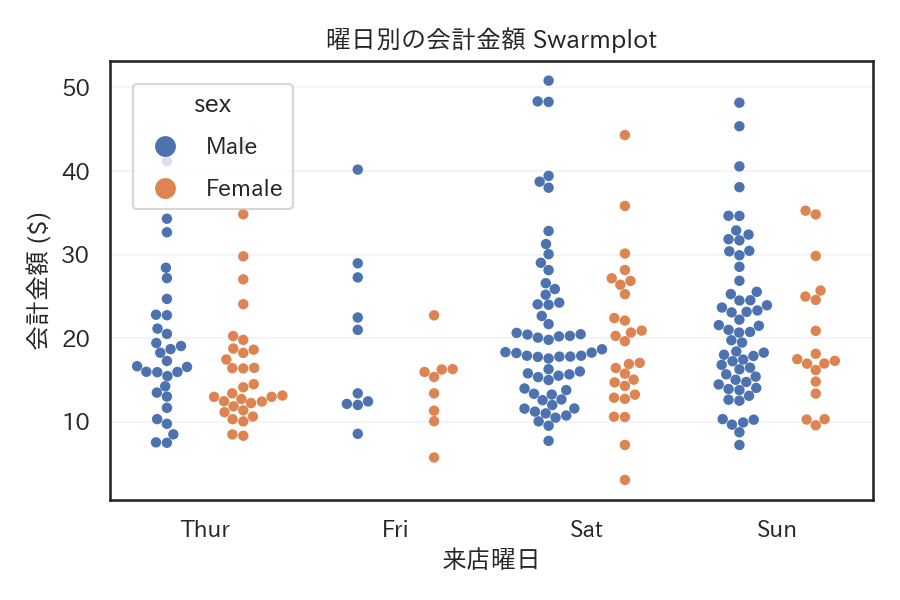 Swarmplot |
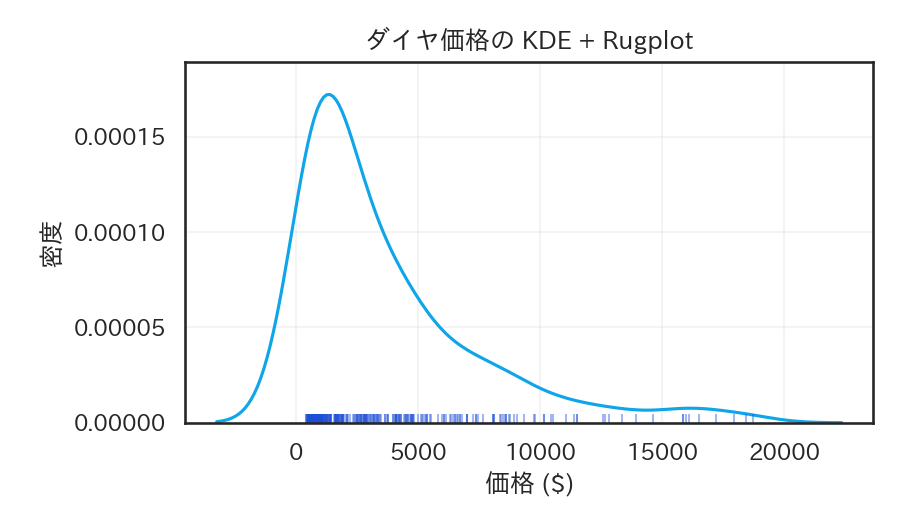 Rug Plot | 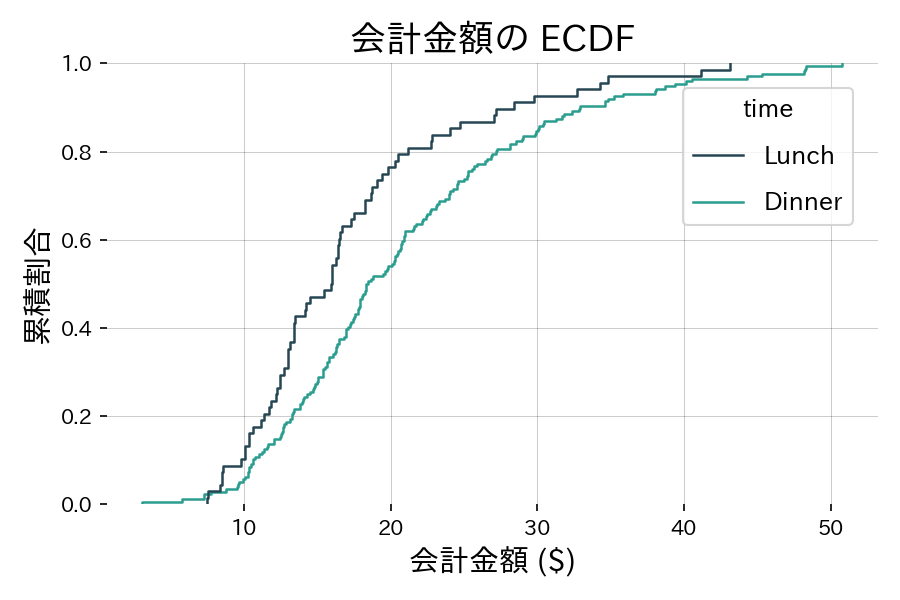 ECDF (Empirical CDF) | 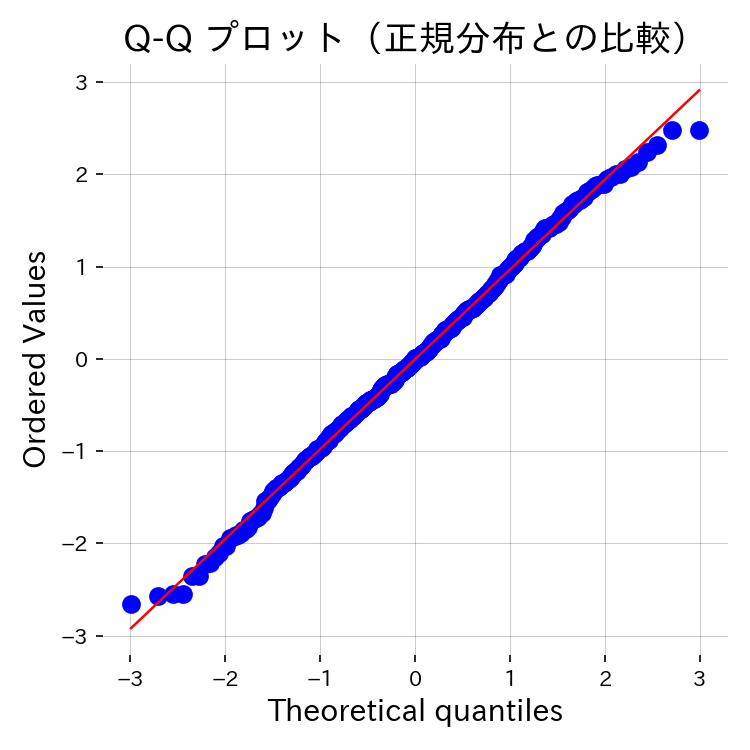 Q‑Q Plot |
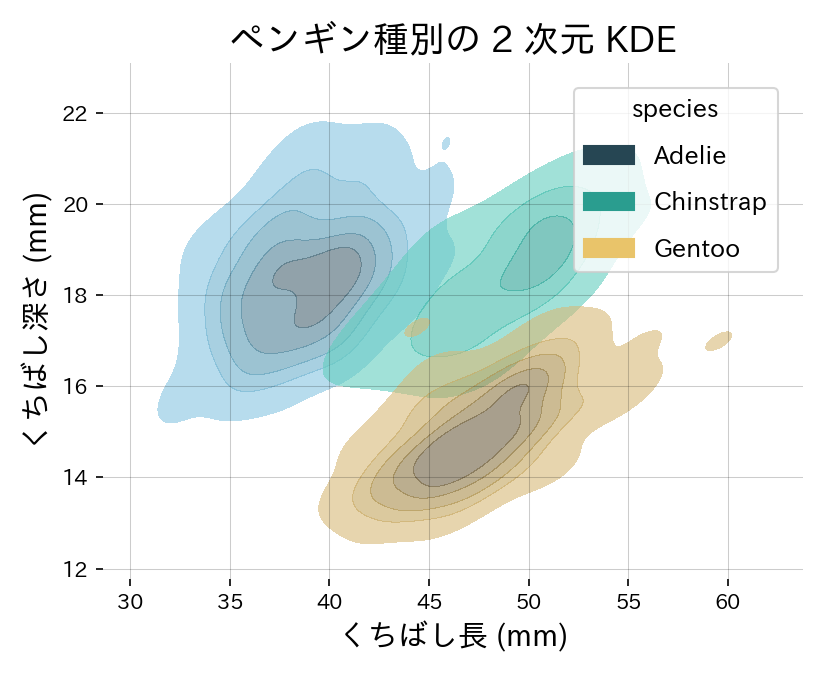 2D KDE |