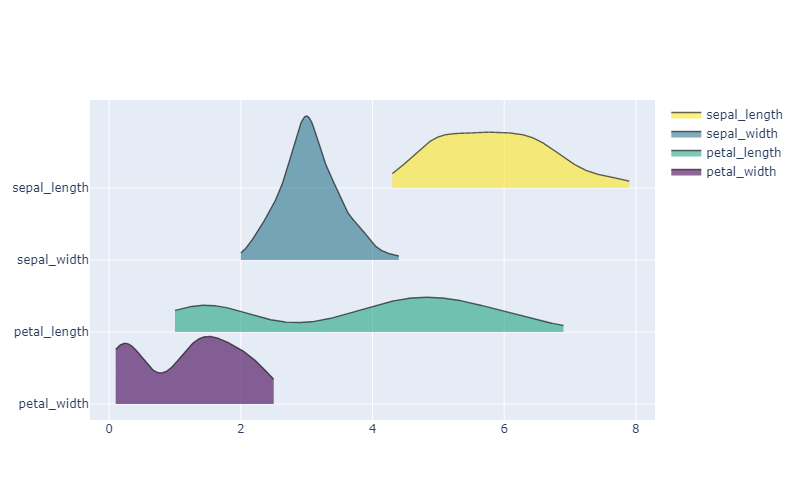
Ridgeline plot
Charts used to visualize the distribution of multiple groups and their differences. Since the chart of distribution is superimposed, it is easy to visualize slight differences in distribution and differences/changes in the position of the vertices for each group.
import numpy as np
import seaborn as sns
from ridgeplot import ridgeplot


# List of columns to be visualized
columns = ["sepal_length", "sepal_width", "petal_length", "petal_width"]

# Sample data
df = sns.load_dataset("iris")
df = df[columns]

# ridgeline plot
fig = ridgeplot(
samples=df.values.T, labels=columns, colorscale="viridis", coloralpha=0.6
)
fig.update_layout(height=500, width=800)
fig.show()
 !
!