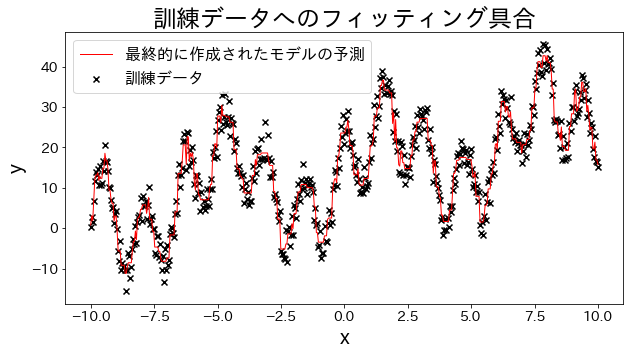
# Datos de entrenamientoX=np.linspace(-10,10,500)[:,np.newaxis]noise=np.random.rand(X.shape[0])*10# Variable objetivoy=((np.sin(X).ravel()+np.cos(4*X).ravel())*10+10+np.linspace(-10,10,500)+noise)# Crear el modelo de regresiónreg=GradientBoostingRegressor(n_estimators=50,learning_rate=0.5,)reg.fit(X,y)y_pred=reg.predict(X)# Evaluar el ajuste del modelo a los datos de entrenamientoplt.figure(figsize=(10,5))plt.scatter(X,y,c="k",marker="x",label="Datos de entrenamiento")plt.plot(X,y_pred,c="r",label="Predicción del modelo final",linewidth=1)plt.xlabel("x")plt.ylabel("y")plt.title("Evaluación del ajuste a los datos de entrenamiento")plt.legend()plt.show()
Efecto de la función de pérdida en los resultados
#
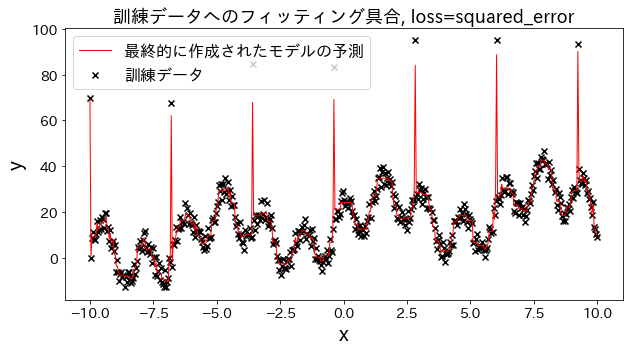
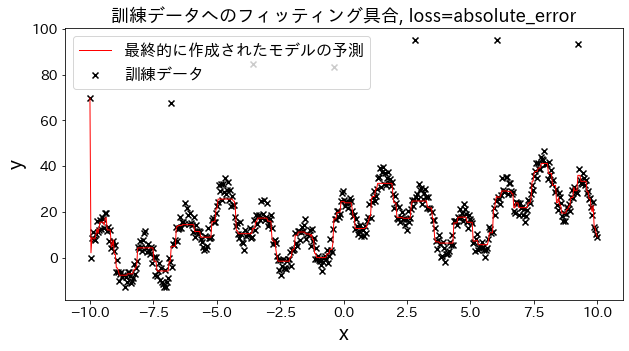
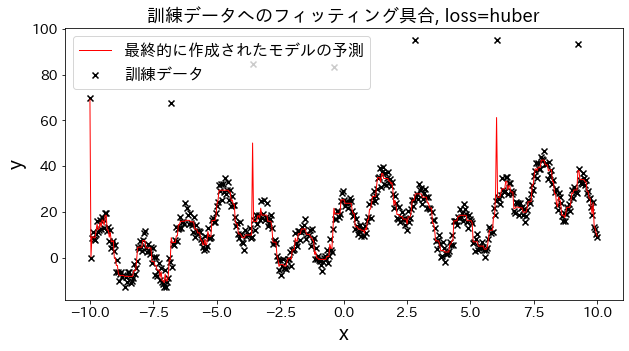
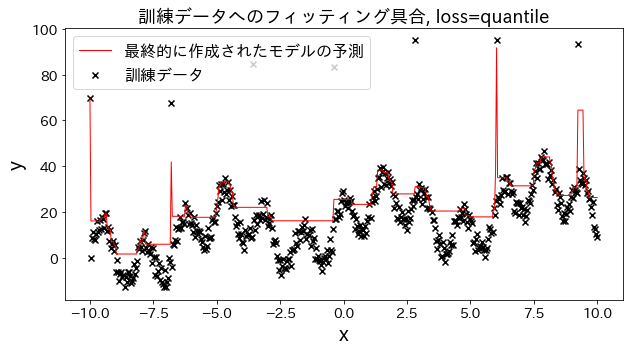
Vamos a observar cómo cambia el ajuste a los datos de entrenamiento al variar el parámetro loss entre las opciones: ["squared_error", "absolute_error", "huber", "quantile"].
Tanto absolute_error como huber aplican penalizaciones menos severas a los valores atípicos en comparación con el error cuadrático, lo que implica que no intentan ajustarse a estos valores atípicos de forma agresiva.
# Datos de entrenamientoX=np.linspace(-10,10,500)[:,np.newaxis]# Introducir valores atípicosnoise=np.random.rand(X.shape[0])*10fori,niinenumerate(noise):ifi%80==0:noise[i]=70+np.random.randint(-10,10)# Variable objetivoy=((np.sin(X).ravel()+np.cos(4*X).ravel())*10+10+np.linspace(-10,10,500)+noise)forlossin["squared_error","absolute_error","huber","quantile"]:# Crear el modelo de regresiónreg=GradientBoostingRegressor(n_estimators=50,learning_rate=0.5,loss=loss,)reg.fit(X,y)y_pred=reg.predict(X)# Evaluar el ajuste del modelo a los datos de entrenamientoplt.figure(figsize=(10,5))plt.scatter(X,y,c="k",marker="x",label="Datos de entrenamiento")plt.plot(X,y_pred,c="r",label="Predicción del modelo final",linewidth=1)plt.xlabel("x")plt.ylabel("y")plt.title(f"Ajuste a los datos de entrenamiento, loss={loss}",fontsize=18)plt.legend()plt.show()
Efecto del parámetro n_estimators en los resultados
#
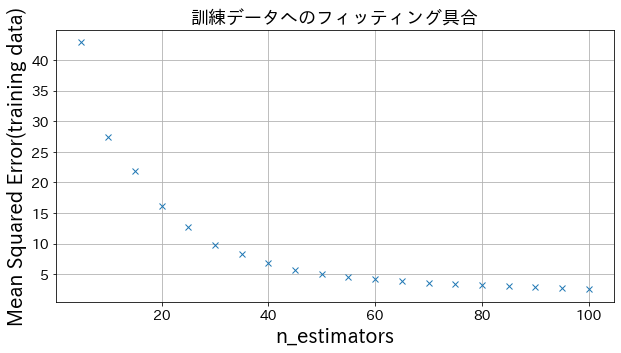
Se puede observar que al aumentar n_estimators hasta cierto punto, la mejora del modelo se estabiliza y deja de ser significativa.
fromsklearn.metricsimportmean_squared_errorasMSE# Datos de entrenamientoX=np.linspace(-10,10,500)[:,np.newaxis]noise=np.random.rand(X.shape[0])*10# Variable objetivoy=((np.sin(X).ravel()+np.cos(4*X).ravel())*10+10+np.linspace(-10,10,500)+noise)# Cambiar n_estimators para crear diferentes modelosn_estimators_list=[(i+1)*5foriinrange(20)]mses=[]forn_estimatorsinn_estimators_list:# Crear el modelo de regresiónreg=GradientBoostingRegressor(n_estimators=n_estimators,learning_rate=0.3,)reg.fit(X,y)y_pred=reg.predict(X)mses.append(MSE(y,y_pred))# Graficar el Mean Squared Error al variar n_estimatorsplt.figure(figsize=(10,5))plt.plot(n_estimators_list,mses,"x")plt.xlabel("n_estimators")plt.ylabel("Error cuadrático medio (datos de entrenamiento)")plt.title("Evaluación del ajuste a los datos de entrenamiento",fontsize=18)plt.grid()plt.show()
Efecto del parámetro learning_rate en los resultados
#
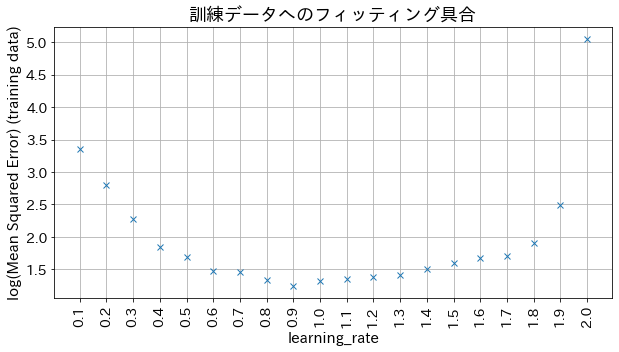
Si el valor de learning_rate es demasiado pequeño, el modelo no logra alcanzar una buena precisión. Por otro lado, si el valor es demasiado grande, el modelo no converge correctamente.
# Cambiar learning_rate para crear diferentes modeloslearning_rate_list=[np.round(0.1*(i+1),1)foriinrange(20)]mses=[]forlearning_rateinlearning_rate_list:# Crear el modelo de regresiónreg=GradientBoostingRegressor(n_estimators=30,learning_rate=learning_rate,)reg.fit(X,y)y_pred=reg.predict(X)mses.append(np.log(MSE(y,y_pred)))# Graficar el log del Mean Squared Error al variar learning_rateplt.figure(figsize=(10,5))plt_index=[iforiinrange(len(learning_rate_list))]plt.plot(plt_index,mses,"x")plt.xticks(plt_index,learning_rate_list,rotation=90)plt.xlabel("learning_rate",fontsize=15)plt.ylabel("log(Mean Squared Error) (datos de entrenamiento)",fontsize=15)plt.title("Evaluación del ajuste a los datos de entrenamiento",fontsize=18)plt.grid()plt.show()