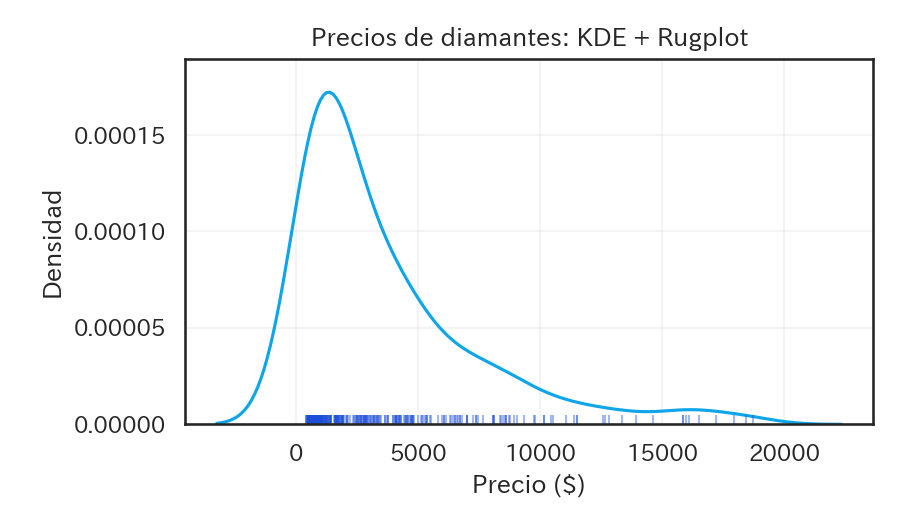
Superponer rugplot sobre un histograma o un KDE permite ver con claridad dónde cae cada observación y facilita la lectura de la distribución.
 1
 2
 3
 4
 5
 6
 7
 8
 9
10
11
12
13
14
15
16
17
importseabornassnsimportmatplotlib.pyplotaspltdiamonds=sns.load_dataset("diamonds").sample(300,random_state=0)fig,ax=plt.subplots(figsize=(6,3.5))sns.kdeplot(data=diamonds,x="price",ax=ax,color="#0ea5e9")sns.rugplot(data=diamonds,x="price",ax=ax,color="#1d4ed8",alpha=0.4)ax.set_xlabel("Precio ($)")ax.set_ylabel("Densidad")ax.set_title("Precios de diamantes: KDE + Rugplot")ax.grid(alpha=0.2)fig.tight_layout()plt.show()