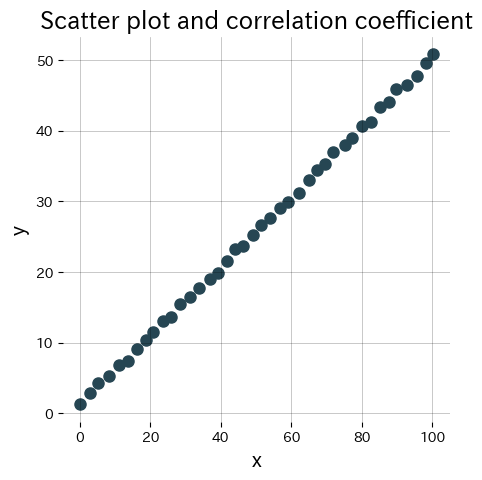
importmatplotlib.pyplotaspltplt.figure(figsize=(5,5))plt.scatter(x,y)plt.xlabel("x")plt.ylabel("y")plt.title("Scatter plot and correlation coefficient")plt.grid(alpha=0.3)plt.show()
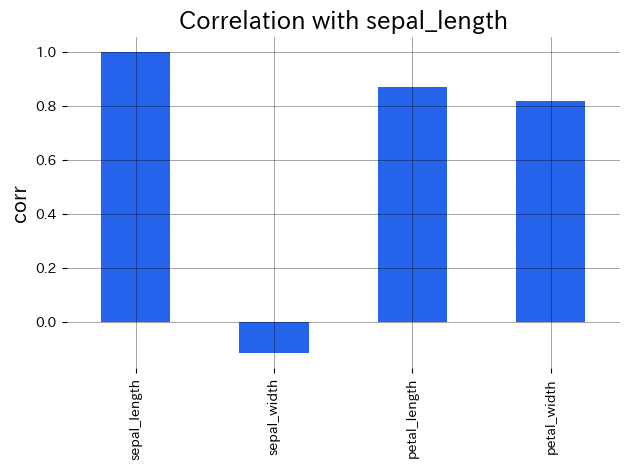
importmatplotlib.pyplotaspltcorrelation["sepal_length"].plot.bar(grid=True,ylabel="corr",color="#2563eb",title="Correlation with sepal_length")plt.tight_layout()plt.show()
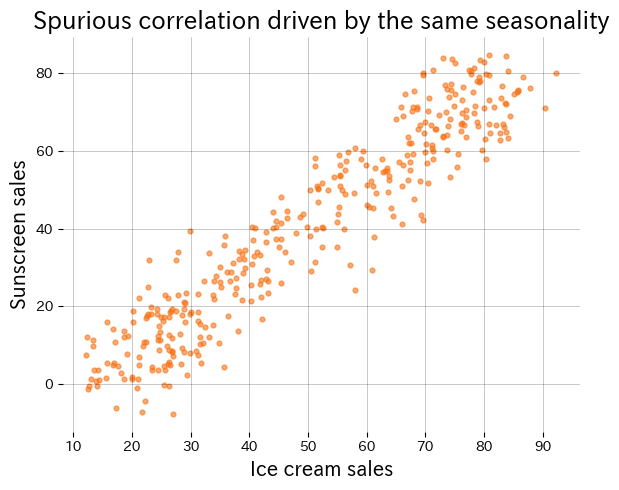
importnumpyasnpimportmatplotlib.pyplotaspltnp.random.seed(123)days=np.arange(365)season=np.sin(2*np.pi*days/365)# 季節を表す共通要因ice_sales=50+30*season+np.random.normal(scale=5,size=days.size)sunscreen_sales=40+35*season+np.random.normal(scale=6,size=days.size)correlation=np.corrcoef(ice_sales,sunscreen_sales)[0,1]print(f"Correlation = {correlation:.3f}")plt.figure(figsize=(6,5))plt.scatter(ice_sales,sunscreen_sales,alpha=0.6,s=18,color="#f97316")plt.xlabel("Ice cream sales")plt.ylabel("Sunscreen sales")plt.title("Spurious correlation driven by the same seasonality")plt.grid(alpha=0.3)plt.tight_layout()plt.show()