まとめ- J-Quants APIで日本株の株価・上場企業情報・財務諸表データを取得する。
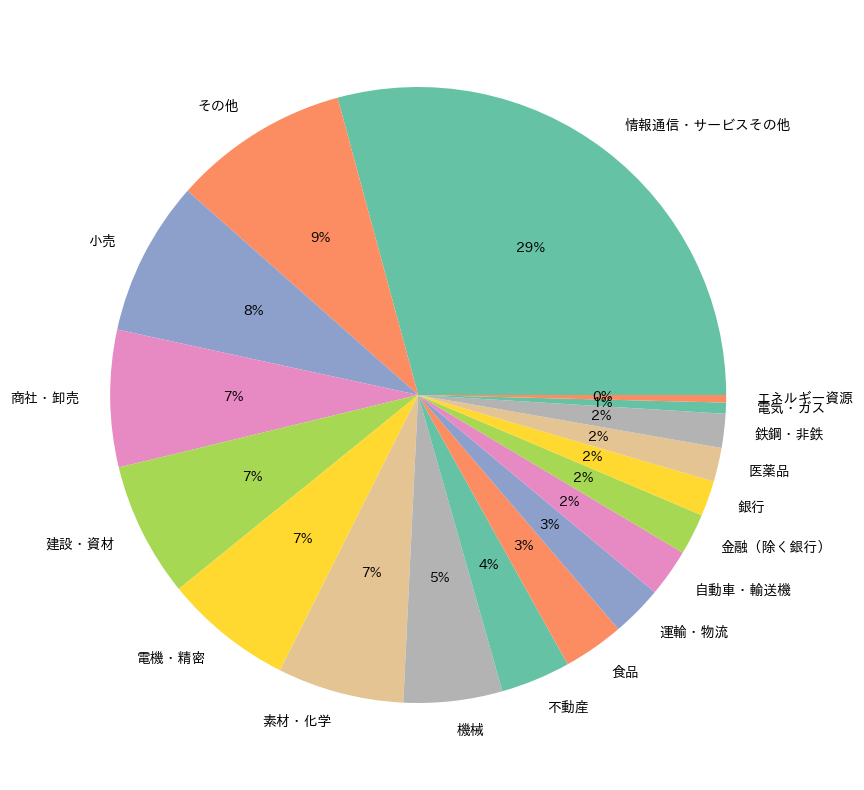
- セクター分布の円グラフやツリーマップで、市場全体の構成を俯瞰する。
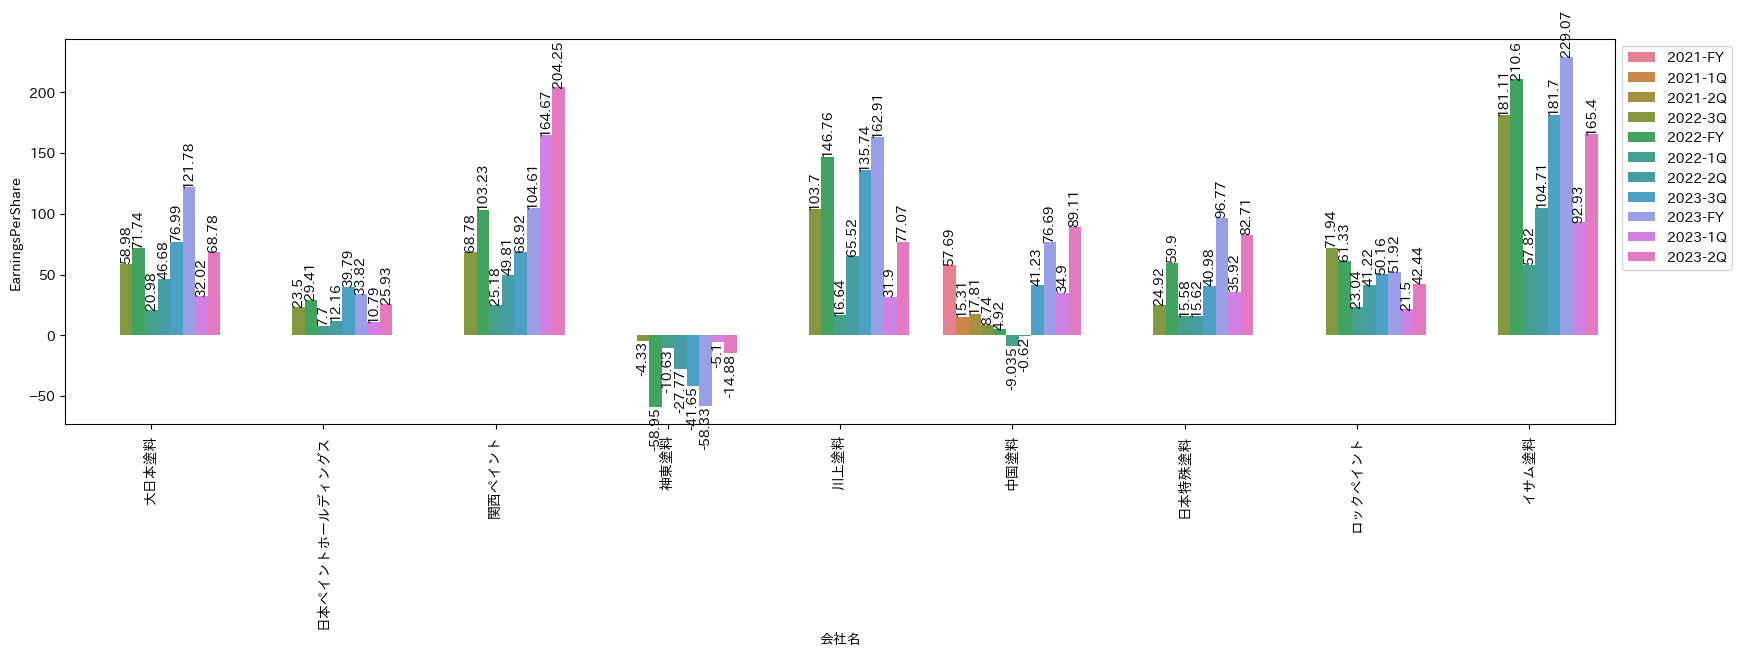
- 複数企業のEPSを棒グラフで比較し、ファンダメンタル分析に活用する。
J-Quants APIを使ってみる
#
 1
 2
 3
 4
 5
 6
 7
 8
 9
10
11
12
13
14
15
16
17
18
| import os
import time
from datetime import datetime
import jquantsapi
import pandas as pd
import requests
from dateutil import tz
REFRESH_TOKEN: str = os.environ.get("JQ_REFRESH_TOKEN")
my_mail_address: str = os.environ.get("JQ_MAIL_ADDRESS")
my_password: str = os.environ.get("JQ_PASSWORD")
cli = jquantsapi.Client(mail_address=my_mail_address, password=my_password)
df = cli.get_price_range(
start_dt=datetime(2022, 7, 25, tzinfo=tz.gettz("Asia/Tokyo")),
end_dt=datetime(2022, 7, 26, tzinfo=tz.gettz("Asia/Tokyo")),
)
print(df)
|
           Date   Code    Open    High     Low   Close UpperLimit LowerLimit  \
0    2022-07-25  13010  3615.0  3660.0  3615.0  3630.0          0          0
0    2022-07-26  13010  3615.0  3640.0  3610.0  3635.0          0          0
1    2022-07-25  13050  2026.5  2037.0  2022.0  2023.0          0          0
1    2022-07-26  13050  2026.0  2029.5  2022.0  2023.5          0          0
2    2022-07-25  13060  2002.5  2015.0  2000.0  2001.0          0          0
...         ...    ...     ...     ...     ...     ...        ...        ...
4191 2022-07-26  99950   403.0   404.0   402.0   404.0          0          0
4192 2022-07-25  99960  1274.0  1274.0  1263.0  1267.0          0          0
4192 2022-07-26  99960  1254.0  1266.0  1254.0  1255.0          0          0
4193 2022-07-25  99970   829.0   831.0   816.0   826.0          0          0
4193 2022-07-26  99970   826.0   827.0   816.0   825.0          0          0

        Volume  TurnoverValue  AdjustmentFactor  AdjustmentOpen  \
0       8100.0   2.942050e+07               1.0          3615.0
0       8500.0   3.083550e+07               1.0          3615.0
1      54410.0   1.103787e+08               1.0          2026.5
1      22950.0   4.646586e+07               1.0          2026.0
2     943830.0   1.891360e+09               1.0          2002.5
...        ...            ...               ...             ...
4191   13000.0   5.240900e+06               1.0           403.0
4192    1500.0   1.902700e+06               1.0          1274.0
4192    4000.0   5.021300e+06               1.0          1254.0
4193  151200.0   1.245601e+08               1.0           829.0
4193  133600.0   1.099946e+08               1.0           826.0

      AdjustmentHigh  AdjustmentLow  AdjustmentClose  AdjustmentVolume
0             3660.0         3615.0           3630.0            8100.0
0             3640.0         3610.0           3635.0            8500.0
1             2037.0         2022.0           2023.0           54410.0
1             2029.5         2022.0           2023.5           22950.0
2             2015.0         2000.0           2001.0          943830.0
...              ...            ...              ...               ...
4191           404.0          402.0            404.0           13000.0
4192          1274.0         1263.0           1267.0            1500.0
4192          1266.0         1254.0           1255.0            4000.0
4193           831.0          816.0            826.0          151200.0
4193           827.0          816.0            825.0          133600.0

[8388 rows x 16 columns]
上場銘柄一覧(/listed/info)
#
 1
 2
 3
 4
 5
 6
 7
 8
 9
10
11
12
13
14
15
16
17
18
| def get_listed_companies(idToken: str):
"""上場銘柄一覧を習得する
Args:
idToken (str): idToken
Returns:
listed_companies (pd.DataFrame): 上場銘柄が記録されたデータフレーム
"""
r = requests.get(
"https://api.jquants.com/v1/listed/info",
headers={"Authorization": "Bearer {}".format(idToken)},
)
if r.status_code == requests.codes.ok:
listed_companies = pd.DataFrame(r.json()["info"]).set_index("Code")
return listed_companies
else:
return None
|
1
2
3
4
5
6
7
| r_post = requests.post(
f"https://api.jquants.com/v1/token/auth_refresh?refreshtoken={REFRESH_TOKEN}"
)
idToken = r_post.json()["idToken"]
listed_companies = get_listed_companies(idToken)
listed_companies.head()
|
| Date | CompanyName | CompanyNameEnglish | Sector17Code | Sector17CodeName | Sector33Code | Sector33CodeName | ScaleCategory | MarketCode | MarketCodeName |
|---|
| Code | | | | | | | | | | |
|---|
| 13010 | 2023-12-06 | 極洋 | KYOKUYO CO.,LTD. | 1 | 食品 | 0050 | 水産・農林業 | TOPIX Small 2 | 0111 | プライム |
|---|
| 13050 | 2023-12-06 | 大和アセットマネジメント株式会社 iFreeETF TOPIX(年1回決算型) | iFreeETF TOPIX (Yearly Dividend Type) | 99 | その他 | 9999 | その他 | - | 0109 | その他 |
|---|
| 13060 | 2023-12-06 | 野村アセットマネジメント株式会社 NEXT FUNDS TOPIX連動型上場投信 | NEXT FUNDS TOPIX Exchange Traded Fund | 99 | その他 | 9999 | その他 | - | 0109 | その他 |
|---|
| 13080 | 2023-12-06 | 日興アセットマネジメント株式会社 上場インデックスファンドTOPIX | Nikko Exchange Traded Index Fund TOPIX | 99 | その他 | 9999 | その他 | - | 0109 | その他 |
|---|
| 13090 | 2023-12-06 | 野村アセットマネジメント株式会社 NEXT FUNDS ChinaAMC・中国株式・上証50... | NEXT FUNDS ChinaAMC SSE50 Index Exchange Trade... | 99 | その他 | 9999 | その他 | - | 0109 | その他 |
|---|
1
2
3
4
| paint_companies = listed_companies[
listed_companies["CompanyName"].str.contains("塗料|ペイント")
]
paint_companies
|
| Date | CompanyName | CompanyNameEnglish | Sector17Code | Sector17CodeName | Sector33Code | Sector33CodeName | ScaleCategory | MarketCode | MarketCodeName |
|---|
| Code | | | | | | | | | | |
|---|
| 46110 | 2023-12-06 | 大日本塗料 | Dai Nippon Toryo Company,Limited | 4 | 素材・化学 | 3200 | 化学 | TOPIX Small 2 | 0111 | プライム |
|---|
| 46120 | 2023-12-06 | 日本ペイントホールディングス | NIPPON PAINT HOLDINGS CO.,LTD. | 4 | 素材・化学 | 3200 | 化学 | TOPIX Mid400 | 0111 | プライム |
|---|
| 46130 | 2023-12-06 | 関西ペイント | KANSAI PAINT CO.,LTD. | 4 | 素材・化学 | 3200 | 化学 | TOPIX Mid400 | 0111 | プライム |
|---|
| 46150 | 2023-12-06 | 神東塗料 | SHINTO PAINT COMPANY,LIMITED | 4 | 素材・化学 | 3200 | 化学 | TOPIX Small 2 | 0112 | スタンダード |
|---|
| 46160 | 2023-12-06 | 川上塗料 | KAWAKAMI PAINT MANUFACTURING CO.,LTD. | 4 | 素材・化学 | 3200 | 化学 | - | 0112 | スタンダード |
|---|
| 46170 | 2023-12-06 | 中国塗料 | Chugoku Marine Paints,Ltd. | 4 | 素材・化学 | 3200 | 化学 | TOPIX Small 1 | 0111 | プライム |
|---|
| 46190 | 2023-12-06 | 日本特殊塗料 | Nihon Tokushu Toryo Co.,Ltd. | 4 | 素材・化学 | 3200 | 化学 | TOPIX Small 2 | 0112 | スタンダード |
|---|
| 46210 | 2023-12-06 | ロックペイント | ROCK PAINT CO.,LTD. | 4 | 素材・化学 | 3200 | 化学 | - | 0112 | スタンダード |
|---|
| 46240 | 2023-12-06 | イサム塗料 | Isamu Paint Co.,Ltd. | 4 | 素材・化学 | 3200 | 化学 | - | 0112 | スタンダード |
|---|
セクターの分布
#
 1
 2
 3
 4
 5
 6
 7
 8
 9
10
11
12
13
14
| import matplotlib.pyplot as plt
import seaborn as sns
sector17_distribution = listed_companies["Sector17CodeName"].value_counts()
colors = sns.color_palette("Set2")
plt.figure(figsize=(10, 10))
plt.pie(
sector17_distribution,
labels=sector17_distribution.index,
colors=colors,
autopct="%.0f%%",
)
plt.show()
|
規模コード
#
 1
 2
 3
 4
 5
 6
 7
 8
 9
10
11
12
13
14
15
16
17
| import plotly.express as px
midcap_categories = ["TOPIX Mid400", "TOPIX Large70", "TOPIX Core30"]
df = px.data.tips()
fig = px.treemap(
listed_companies[listed_companies["ScaleCategory"].isin(midcap_categories)],
path=["Sector17CodeName", "Sector33CodeName"],
)
fig.show()
df = px.data.tips()
fig = px.treemap(
listed_companies[listed_companies["ScaleCategory"].isin(midcap_categories)],
path=["Sector17CodeName", "Sector33CodeName", "ScaleCategory"],
)
fig.show()
|
財務情報の取得
#
 1
 2
 3
 4
 5
 6
 7
 8
 9
10
| def get_statements(idToken, code):
time.sleep(0.5)
r = requests.get(
f"https://api.jquants.com/v1/fins/statements?code={code}",
headers={"Authorization": "Bearer {}".format(idToken)},
)
if r.status_code == requests.codes.ok:
return r.json()["statements"]
else:
return None
|
1
2
| res = get_statements(idToken, 86970)
res
|
[{'DisclosedDate': '2022-01-27',
  'DisclosedTime': '12:00:00',
  'LocalCode': '86970',
  'DisclosureNumber': '20220126573026',
  'TypeOfDocument': '3QFinancialStatements_Consolidated_IFRS',
  'TypeOfCurrentPeriod': '3Q',
  'CurrentPeriodStartDate': '2021-04-01',
  'CurrentPeriodEndDate': '2021-12-31',
  'CurrentFiscalYearStartDate': '2021-04-01',
  'CurrentFiscalYearEndDate': '2022-03-31',
  'NextFiscalYearStartDate': '',
  'NextFiscalYearEndDate': '',
  'NetSales': '100586000000',
  'OperatingProfit': '55967000000',
  'OrdinaryProfit': '',
  'Profit': '38013000000',
  'EarningsPerShare': '71.71',
  'DilutedEarningsPerShare': '',
  'TotalAssets': '62076519000000',
  'Equity': '311381000000',
  ...
  'NonConsolidatedProfit': '',
  'NonConsolidatedEarningsPerShare': '',
  'NonConsolidatedTotalAssets': '',
  'NonConsolidatedEquity': '',
  'NonConsolidatedEquityToAssetRatio': '',
  'NonConsolidatedBookValuePerShare': '',
  'ForecastNonConsolidatedNetSales2ndQuarter': '',
  'ForecastNonConsolidatedOperatingProfit2ndQuarter': '',
  'ForecastNonConsolidatedOrdinaryProfit2ndQuarter': '',
  'ForecastNonConsolidatedProfit2ndQuarter': '',
  'ForecastNonConsolidatedEarningsPerShare2ndQuarter': '',
  'NextYearForecastNonConsolidatedNetSales2ndQuarter': '',
  'NextYearForecastNonConsolidatedOperatingProfit2ndQuarter': '',
  'NextYearForecastNonConsolidatedOrdinaryProfit2ndQuarter': '',
  'NextYearForecastNonConsolidatedProfit2ndQuarter': '',
  'NextYearForecastNonConsolidatedEarningsPerShare2ndQuarter': '',
  'ForecastNonConsolidatedNetSales': '',
  'ForecastNonConsolidatedOperatingProfit': '',
  'ForecastNonConsolidatedOrdinaryProfit': '',
  'ForecastNonConsolidatedProfit': '',
  'ForecastNonConsolidatedEarningsPerShare': '',
  'NextYearForecastNonConsolidatedNetSales': '',
  'NextYearForecastNonConsolidatedOperatingProfit': '',
  'NextYearForecastNonConsolidatedOrdinaryProfit': '',
  'NextYearForecastNonConsolidatedProfit': '',
  'NextYearForecastNonConsolidatedEarningsPerShare': ''}]
 1
 2
 3
 4
 5
 6
 7
 8
 9
10
11
| paint_companies_statements = pd.concat(
[pd.DataFrame(get_statements(idToken, code)) for code in paint_companies.index]
)
for c in paint_companies_statements.filter(
regex="Sales|Assets|CashFlows|Profit|Equity|EarningsPerShare"
).columns:
paint_companies_statements[c] = pd.to_numeric(paint_companies_statements[c])
for c in paint_companies_statements.filter(regex="Date").columns:
paint_companies_statements[c] = pd.to_datetime(paint_companies_statements[c])
|
 1
 2
 3
 4
 5
 6
 7
 8
 9
10
| sorted_data = paint_companies_statements.groupby(["LocalCode"]).apply(
lambda x: x.sort_values(["DisclosureNumber"], ascending=False)
)
sorted_data["決算期"] = sorted_data.apply(
lambda row: f"{row['DisclosedDate'].year}-{row['TypeOfCurrentPeriod']}", axis=1
)
sorted_data["会社名"] = [
paint_companies.at[code, "CompanyName"] for code in sorted_data["LocalCode"]
]
sorted_data
|
| | DisclosedDate | DisclosedTime | LocalCode | DisclosureNumber | TypeOfDocument | TypeOfCurrentPeriod | ... | 決算期 | 会社名 |
|---|
| LocalCode | | | | | | | | | | |
|---|
| 46110 | 8 | 2023-11-09 | 14:00:00 | 46110 | 20231020569248 | 2QFinancialStatements_Consolidated_JP | 2Q | ... | 2023-2Q | 大日本塗料 |
|---|
| 7 | 2023-08-08 | 14:00:00 | 46110 | 20230721525034 | 1QFinancialStatements_Consolidated_JP | 1Q | ... | 2023-1Q | 大日本塗料 |
|---|
| 6 | 2023-05-11 | 14:00:00 | 46110 | 20230421551091 | FYFinancialStatements_Consolidated_JP | FY | ... | 2023-FY | 大日本塗料 |
|---|
| 5 | 2023-02-09 | 14:00:00 | 46110 | 20230123592325 | 3QFinancialStatements_Consolidated_JP | 3Q | ... | 2023-3Q | 大日本塗料 |
|---|
| 4 | 2022-10-27 | 14:00:00 | 46110 | 20221024548184 | EarnForecastRevision | 2Q | ... | 2022-2Q | 大日本塗料 |
|---|
| 46240 | 4 | 2023-02-09 | 13:00:00 | 46240 | 20230123592504 | 3QFinancialStatements_Consolidated_JP | 3Q | ... | 2023-3Q | イサム塗料 |
|---|
| 3 | 2022-11-07 | 13:00:00 | 46240 | 20221024547981 | 2QFinancialStatements_Consolidated_JP | 2Q | ... | 2022-2Q | イサム塗料 |
|---|
| 2 | 2022-08-05 | 13:00:00 | 46240 | 20220722503491 | 1QFinancialStatements_Consolidated_JP | 1Q | ... | 2022-1Q | イサム塗料 |
|---|
| 1 | 2022-05-10 | 13:00:00 | 46240 | 20220426528461 | FYFinancialStatements_Consolidated_JP | FY | ... | 2022-FY | イサム塗料 |
|---|
| 0 | 2022-02-09 | 13:00:00 | 46240 | 20220124571237 | 3QFinancialStatements_Consolidated_JP | 3Q | ... | 2022-3Q | イサム塗料 |
|---|
91 rows × 108 columns
 1
 2
 3
 4
 5
 6
 7
 8
 9
10
11
12
13
14
15
16
17
18
19
20
21
22
23
24
25
26
27
| plt.figure(figsize=(20, 5))
hue_order = [
"2021-FY",
"2021-1Q",
"2021-2Q",
"2022-3Q",
"2022-FY",
"2022-1Q",
"2022-2Q",
"2023-3Q",
"2023-FY",
"2023-1Q",
"2023-2Q",
]
ax = sns.barplot(
data=sorted_data,
x="会社名",
y="EarningsPerShare",
hue="決算期",
hue_order=hue_order,
)
for c in ax.containers:
ax.bar_label(c, rotation=90, fontsize=10)
plt.xticks(rotation=90)
plt.legend(loc="upper left", bbox_to_anchor=(1, 1))
plt.show()
|