2.5.3
X-means
Ringkasan
- X-means memperluas K-means dengan estimasi jumlah cluster otomatis menggunakan kriteria BIC/MDL.
- Batas cluster minimum dan maksimum membatasi ruang pencarian agar tidak terjadi over-splitting.
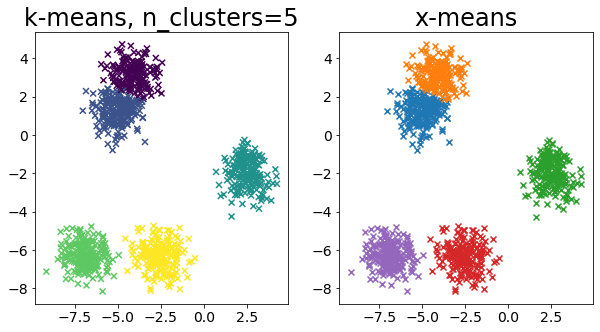
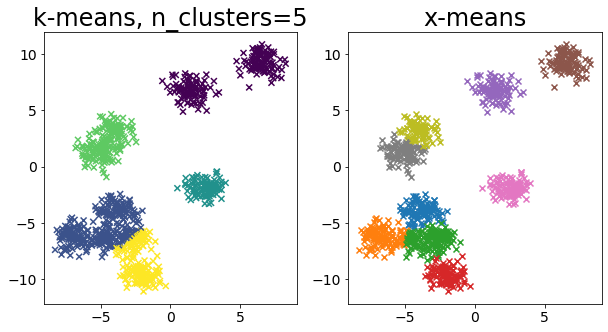
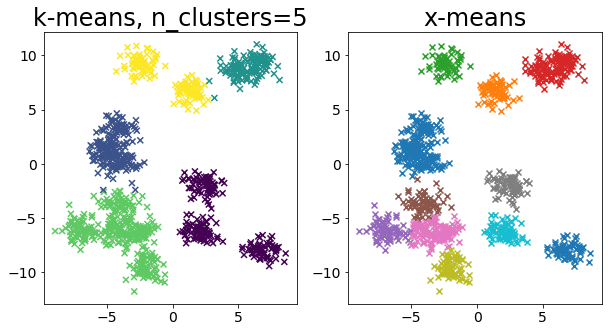
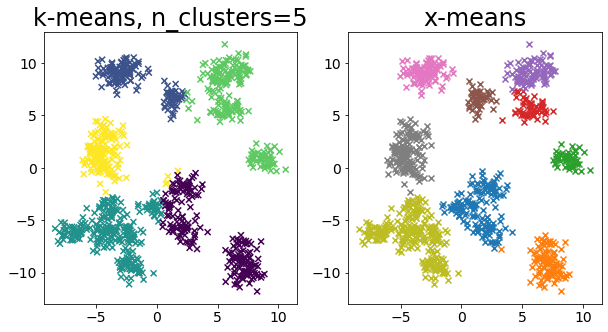
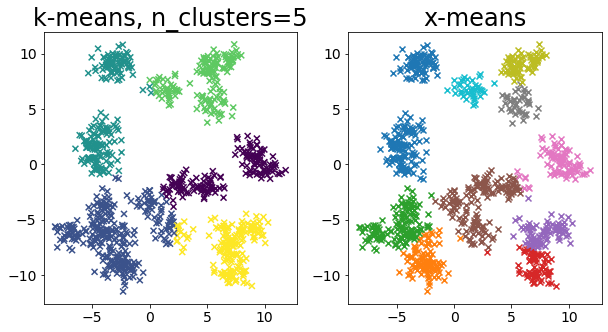
- Perbandingan K-means (k tetap) vs X-means menunjukkan dampak pemilihan jumlah cluster terhadap interpretasi hasil.
Intuisi #
X-means menggunakan pola split-and-test: mulai dari cluster kasar, lalu membelah hanya jika skor statistik membaik. Pendekatan ini mengurangi trial-and-error manual untuk memilih k sekaligus menjaga kompleksitas tetap terkendali.
Penjelasan Rinci #
<p>X-means adalah jenis algoritma pengelompokan yang secara otomatis menentukan jumlah cluster saat pengelompokan berlangsung. Halaman ini membandingkan hasil dari k-means++ dan X-means.</p>
Pelleg, Dan, and Andrew W. Moore. “X-means: Extending k-means with efficient estimation of the number of clusters.” Icml. Vol. 1. 2000.
import numpy as np
import matplotlib.pyplot as plt

from sklearn.cluster import KMeans
from sklearn.datasets import make_blobs
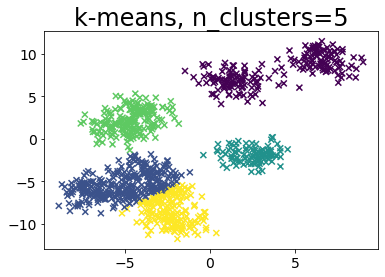
When k is pre-specified in k-means #
def plot_by_kmeans(X, k=5):
    y_pred = KMeans(n_clusters=k, random_state=random_state, init="random").fit_predict(
        X
    )

    plt.scatter(X[:, 0], X[:, 1], c=y_pred, marker="x")
    plt.title(f"k-means, n_clusters={k}")

# Membuat data sampel
n_samples = 1000
random_state = 117117
X, _ = make_blobs(
    n_samples=n_samples, random_state=random_state, cluster_std=1, centers=10
)

# Jalankan k-means++.
plot_by_kmeans(X)
Jalankan tanpa menentukan jumlah cluster dalam x-mean #
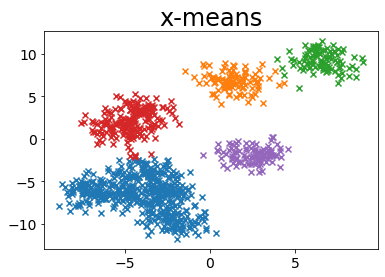
BIC (kriteria informasi bayesian) #
from pyclustering.cluster.xmeans import xmeans
from pyclustering.cluster.center_initializer import kmeans_plusplus_initializer

BAYESIAN_INFORMATION_CRITERION = 0
MINIMUM_NOISELESS_DESCRIPTION_LENGTH = 1

def plot_by_xmeans(
    X, c_min=3, c_max=10, criterion=BAYESIAN_INFORMATION_CRITERION, tolerance=0.025
):
    initial_centers = kmeans_plusplus_initializer(X, c_min).initialize()
    xmeans_instance = xmeans(
        X, initial_centers, c_max, criterion=criterion, tolerance=tolerance
    )
    xmeans_instance.process()

    # Membuat data untuk plot
    clusters = xmeans_instance.get_clusters()
    n_samples = X.shape[0]
    c = []
    for i, cluster_i in enumerate(clusters):
        X_ci = X[cluster_i]
        color_ci = [i for _ in cluster_i]
        plt.scatter(X_ci[:, 0], X_ci[:, 1], marker="x")
    plt.title("x-means")

# Jalankan x-means
plot_by_xmeans(X, c_min=3, c_max=10, criterion=BAYESIAN_INFORMATION_CRITERION)
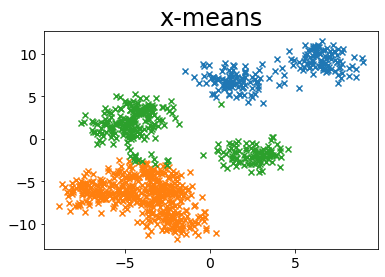
MINIMUM_NOISELESS_DESCRIPTION_LENGTH #
plot_by_xmeans(X, c_min=3, c_max=10, criterion=MINIMUM_NOISELESS_DESCRIPTION_LENGTH)
Pengaruh parameter toleransi #
X, _ = make_blobs(
    n_samples=2000,
    random_state=random_state,
    cluster_std=0.4,
    centers=10,
)

plt.figure(figsize=(25, 5))
for i, ti in enumerate(np.linspace(0.0001, 1, 5)):
    ti = np.round(ti, 4)
    plt.subplot(1, 10, i + 1)
    plot_by_xmeans(
        X, c_min=3, c_max=10, criterion=BAYESIAN_INFORMATION_CRITERION, tolerance=ti
    )
    plt.title(f"tol={ti}")
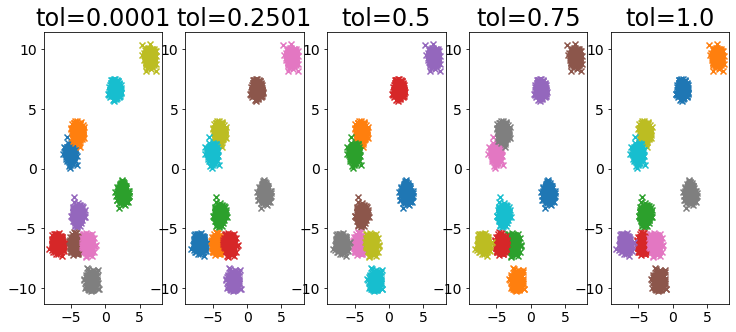
Bandingkan k-means dan x-means untuk berbagai data #
for i in range(5):
    X, _ = make_blobs(
        n_samples=n_samples,
        random_state=random_state,
        cluster_std=0.7,
        centers=5 + i * 5,
    )
    plt.figure(figsize=(10, 5))
    plt.subplot(1, 2, 1)
    plot_by_kmeans(X)
    plt.subplot(1, 2, 2)
    plot_by_xmeans(X, c_min=3, c_max=20)
    plt.show()
