2.4.5
Peningkatan gradient
Ringkasan
- Menyusun tujuan metode, asumsi, dan kondisi penggunaan yang tepat.
- Menilai bagaimana aturan update atau kriteria split memengaruhi perilaku model.
- Menggunakan contoh implementasi untuk memandu keputusan tuning parameter.
Intuisi #
Buat data eksperimen, data bentuk gelombang dengan fungsi trigonometri yang ditambahkan bersama-sama.
Penjelasan Rinci #
import numpy as np
import matplotlib.pyplot as plt
import japanize_matplotlib
from sklearn.ensemble import GradientBoostingRegressor
Cocokkan model regresi ke data pelatihan #
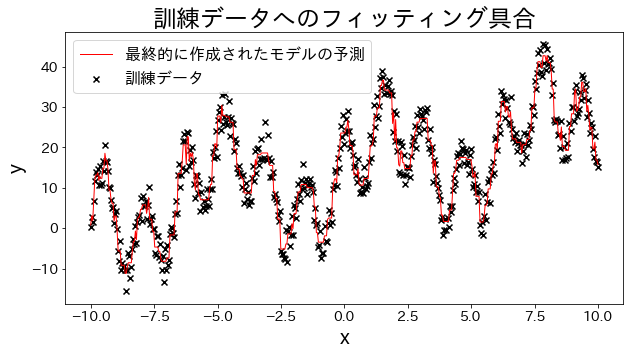
Buat data eksperimen, data bentuk gelombang dengan fungsi trigonometri yang ditambahkan bersama-sama.
# training dataset
X = np.linspace(-10, 10, 500)[:, np.newaxis]
noise = np.random.rand(X.shape[0]) * 10

# target
y = (
    (np.sin(X).ravel() + np.cos(4 * X).ravel()) * 10
    + 10
    + np.linspace(-10, 10, 500)
    + noise
)

# train gradient boosting
reg = GradientBoostingRegressor(
    n_estimators=50,
    learning_rate=0.5,
)
reg.fit(X, y)
y_pred = reg.predict(X)

# Check the fitting to the training data
plt.figure(figsize=(10, 5))
plt.scatter(X, y, c="k", marker="x", label="training data")
plt.plot(X, y_pred, c="r", label="Predictions for the final created model", linewidth=1)
plt.xlabel("x")
plt.ylabel("y")
plt.title("Degree of fitting to training dataset")
plt.legend()
plt.show()
Pengaruh fungsi loss pada hasil #
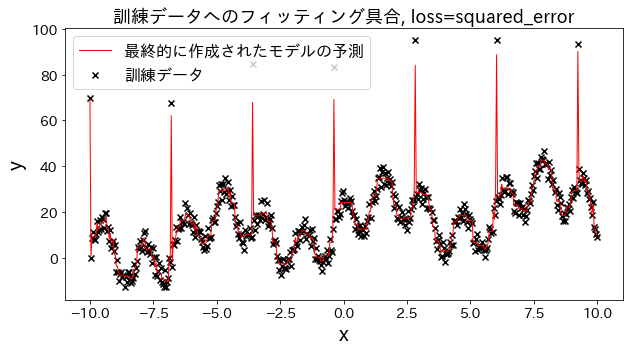
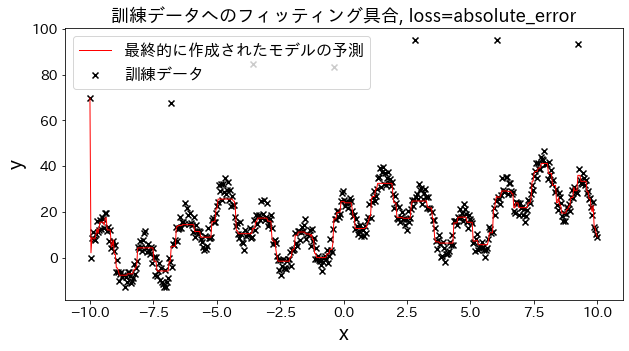
Periksa bagaimana fitting terhadap data training berubah ketika loss diubah menjadi [“squared_error”, “absolute_error”, “huber”, “quantile”]." Diharapkan bahwa “absolute_error” dan “huber” tidak akan terus memprediksi outlier karena penalti untuk outlier tidak sebesar squared error.
# training data
X = np.linspace(-10, 10, 500)[:, np.newaxis]

# prepare outliers
noise = np.random.rand(X.shape[0]) * 10
for i, ni in enumerate(noise):
    if i % 80 == 0:
        noise[i] = 70 + np.random.randint(-10, 10)

# target
y = (
    (np.sin(X).ravel() + np.cos(4 * X).ravel()) * 10
    + 10
    + np.linspace(-10, 10, 500)
    + noise
)

for loss in ["squared_error", "absolute_error", "huber", "quantile"]:
    # train gradient boosting
    reg = GradientBoostingRegressor(
        n_estimators=50,
        learning_rate=0.5,
        loss=loss,
    )
    reg.fit(X, y)
    y_pred = reg.predict(X)

    # Check the fitting to the training data.
    plt.figure(figsize=(10, 5))
    plt.scatter(X, y, c="k", marker="x", label="training dataset")
    plt.plot(X, y_pred, c="r", label="Predictions for the final created model", linewidth=1)
    plt.xlabel("x")
    plt.ylabel("y")
    plt.title(f"Degree of fitting to training data, loss={loss}", fontsize=18)
    plt.legend()
    plt.show()
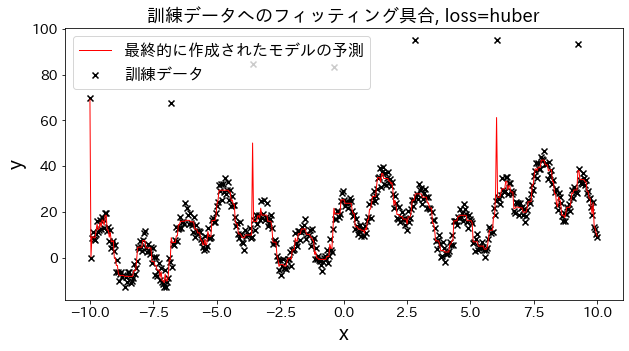
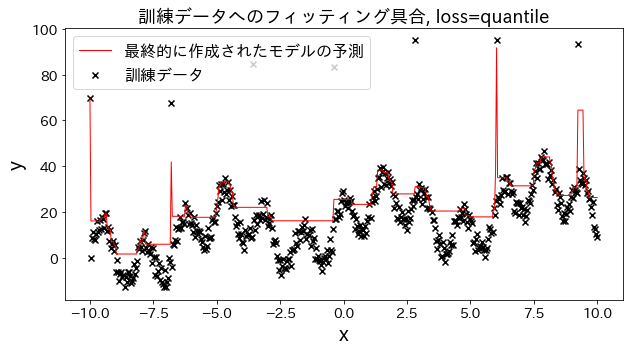
Pengaruh n_estimators pada hasil
#
Anda bisa melihat bagaimana tingkat perbaikan akan meningkat ketika Anda meningkatkan n_estimators sampai batas tertentu.
from sklearn.metrics import mean_squared_error as MSE

# trainig dataset
X = np.linspace(-10, 10, 500)[:, np.newaxis]
noise = np.random.rand(X.shape[0]) * 10

# target
y = (
    (np.sin(X).ravel() + np.cos(4 * X).ravel()) * 10
    + 10
    + np.linspace(-10, 10, 500)
    + noise
)

# Try to create a model with different n_estimators
n_estimators_list = [(i + 1) * 5 for i in range(20)]
mses = []
for n_estimators in n_estimators_list:
    reg = GradientBoostingRegressor(
        n_estimators=n_estimators,
        learning_rate=0.3,
    )
    reg.fit(X, y)
    y_pred = reg.predict(X)
    mses.append(MSE(y, y_pred))

# Plotting mean_squared_error for different n_estimators
plt.figure(figsize=(10, 5))
plt.plot(n_estimators_list, mses, "x")
plt.xlabel("n_estimators")
plt.ylabel("Mean Squared Error(training data)")
plt.grid()
plt.show()
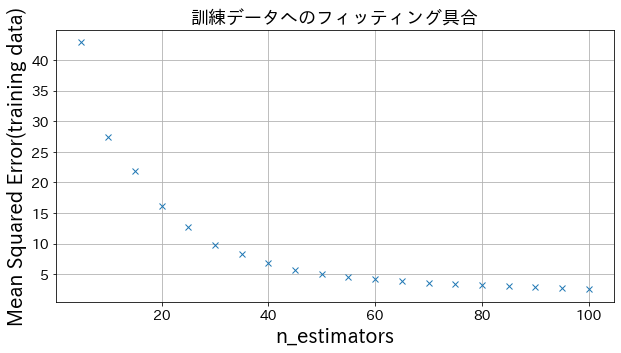
Dampak dari learning_rate pada hasil #
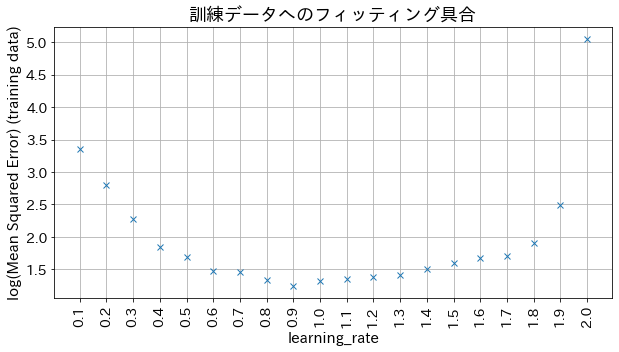
Jika learning_rate terlalu kecil, akurasi tidak meningkat, dan jika learning_rate terlalu besar, tidak akan konvergen.
# Try to create a model with different n_estimators
learning_rate_list = [np.round(0.1 * (i + 1), 1) for i in range(20)]
mses = []
for learning_rate in learning_rate_list:
    reg = GradientBoostingRegressor(
        n_estimators=30,
        learning_rate=learning_rate,
    )
    reg.fit(X, y)
    y_pred = reg.predict(X)
    mses.append(np.log(MSE(y, y_pred)))

# Plotting mean_squared_error for different n_estimators
plt.figure(figsize=(10, 5))
plt_index = [i for i in range(len(learning_rate_list))]
plt.plot(plt_index, mses, "x")
plt.xticks(plt_index, learning_rate_list, rotation=90)
plt.xlabel("learning_rate", fontsize=15)
plt.ylabel("log(Mean Squared Error) (training data)", fontsize=15)
plt.grid()
plt.show()
