Visualisasi Gradient Boosting

2.4.6

Visualisasi Gradient Boosting

Diperbarui 2020-04-08 Baca 2 menit
Ringkasan
  • Visualisasi Gradient Boosting memperlihatkan bagaimana tiap pohon memperbaiki residual dari tahap sebelumnya.
  • Melihat prediksi antar-tahap memudahkan diagnosis underfitting, overfitting, dan jadwal belajar yang tidak stabil.
  • Pengaturan learning_rate dan n_estimators jadi lebih terarah karena didukung bukti visual.

Intuisi #

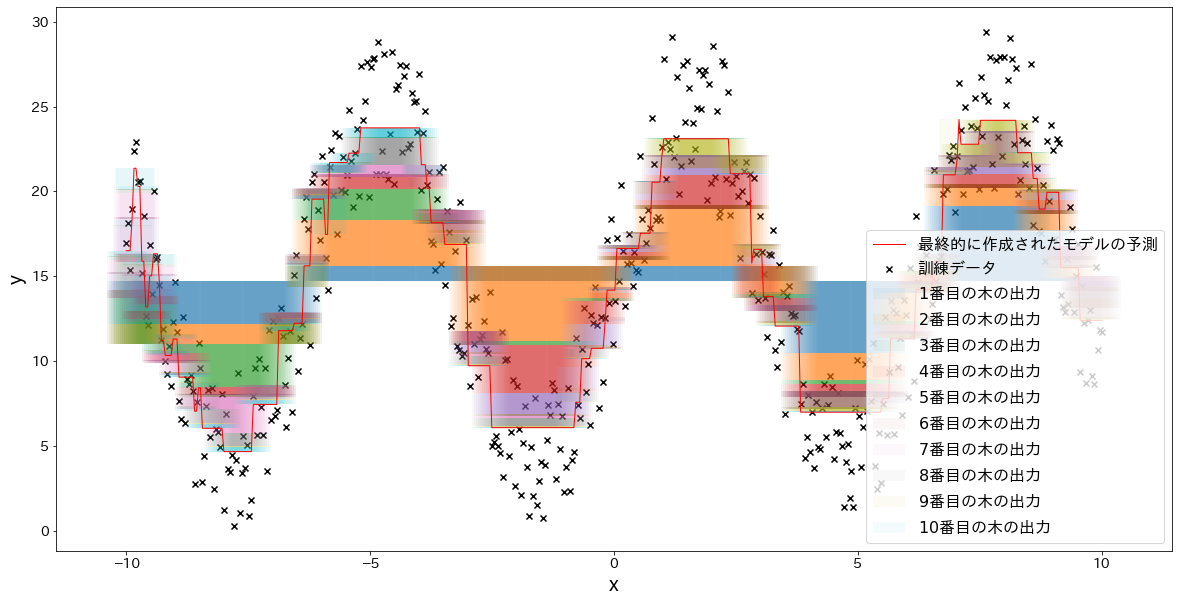
Intinya bukan hanya hasil akhir, tetapi lintasan pembelajarannya. Dengan melihat kontribusi tiap tahap, mekanisme aditif boosting menjadi jelas dan mudah dijelaskan.
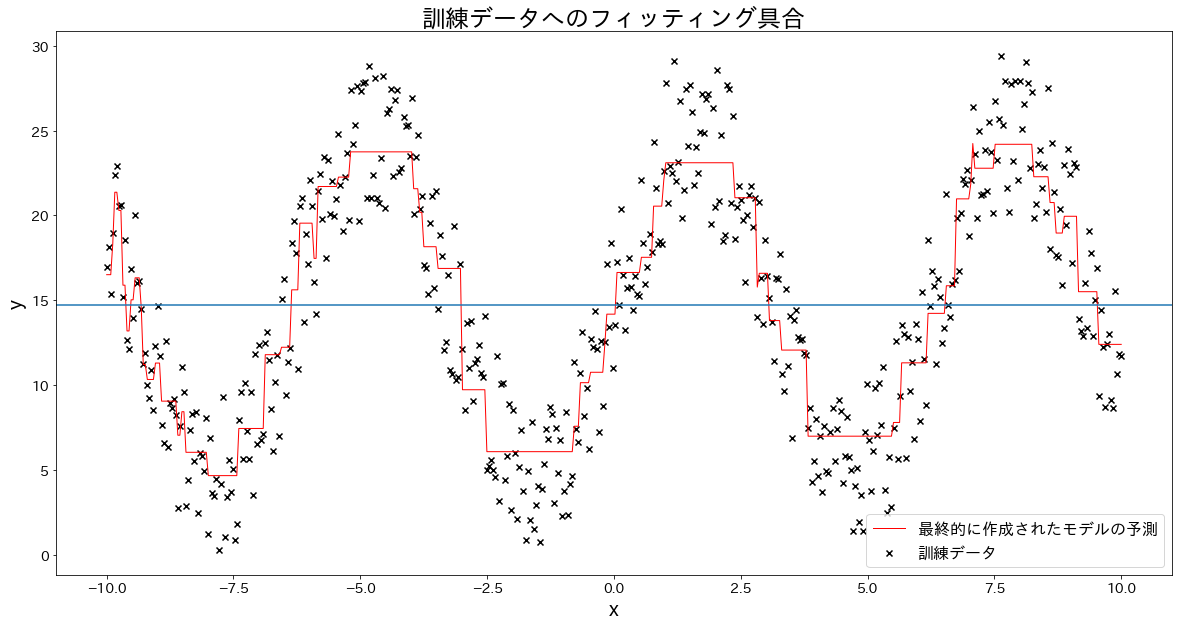
Penjelasan Rinci #

Latih dan prediksi akhir #

 1
 2
 3
 4
 5
 6
 7
 8
 9
10
11
12
13
14
15
16
17
18
19
20
21
22
23
n_samples = 500
X = np.linspace(-10, 10, n_samples)[:, np.newaxis]
noise = np.random.rand(X.shape[0]) * 10
y = (np.sin(X).ravel()) * 10 + 10 + noise

n_estimators = 10
learning_rate = 0.5
reg = GradientBoostingRegressor(
    n_estimators=n_estimators,
    learning_rate=learning_rate,
)
reg.fit(X, y)
y_pred = reg.predict(X)

plt.figure(figsize=(20, 10))
plt.scatter(X, y, c="k", marker="x", label="latih")
plt.plot(X, y_pred, c="r", label="akhir", linewidth=1)
plt.xlabel("x")
plt.ylabel("y")
plt.axhline(y=np.mean(y), color="gray", linestyle=":", label="baseline")
plt.title("Pencocokan pada data latih")
plt.legend()
plt.show()

Latih dan prediksi akhir (diagram)

Tumpuk kontribusi tiap pohon #

 1
 2
 3
 4
 5
 6
 7
 8
 9
10
11
12
13
fig, ax = plt.subplots(figsize=(20, 10))
temp = np.zeros(n_samples) + np.mean(y)

for i in range(n_estimators):
    res = reg.estimators_[i][0].predict(X) * learning_rate
    ax.bar(X.flatten(), res, bottom=temp, label=f"pohon {i+1}", alpha=0.05)
    temp += res

plt.scatter(X.flatten(), y, c="k", marker="x", label="latih")
plt.plot(X, y_pred, c="r", label="akhir", linewidth=1)
plt.legend()
plt.xlabel("x")
plt.ylabel("y")

Tumpuk kontribusi tiap pohon (diagram)

Tumpukan parsial (perbaikan bertahap) #

 1
 2
 3
 4
 5
 6
 7
 8
 9
10
11
12
13
14
15
for i in range(5):
    fig, ax = plt.subplots(figsize=(20, 10))
    plt.title(f"Hingga pohon {i+1}")
    temp = np.zeros(n_samples) + np.mean(y)

    for j in range(i + 1):
        res = reg.estimators_[j][0].predict(X) * learning_rate
        ax.bar(X.flatten(), res, bottom=temp, label=f"{j+1}", alpha=0.05)
        temp += res

    plt.scatter(X.flatten(), y, c="k", marker="x", label="latih")
    plt.legend()
    plt.xlabel("x")
    plt.ylabel("y")
    plt.show()