2.3.3
Parameter pohon
- Pohon keputusan memiliki banyak pengaturan—kedalaman, jumlah sampel minimum per split/leaf, pruning, dan bobot kelas—yang menentukan kapasitas serta kemudahan interpretasi.
max_depthdanmin_samples_leafmembatasi seberapa rinci aturan yang terbentuk, sedangkanccp_alpha(cost-complexity pruning) menghapus cabang yang kontribusinya kecil.- Memilih kriteria yang tepat (
squared_error,absolute_error,friedman_mse, dll.) mengubah sensitivitas pohon terhadap pencilan. - Visualisasi permukaan prediksi dan struktur pohon mempermudah penjelasan mengapa kombinasi hiperparameter tertentu bekerja paling baik.
Intuisi #
Metode ini dipahami lewat asumsi dasarnya, karakteristik data, dan dampak pengaturan parameter terhadap generalisasi.
Penjelasan Rinci #
1. Gambaran umum #
Jika tidak dibatasi, pohon akan terus membelah hingga setiap daun murni—cenderung overfitting. Hiperparameter berperan sebagai regularisasi: kedalaman menjaga pohon tetap dangkal, batas sampel minimum mencegah daun kecil, dan pruning merapikan cabang yang tidak sepadan dengan biayanya.
2. Gain impunitas dan pruning cost-complexity #
Untuk node induk (P) dengan anak (L) dan (R), penurunan impuritas adalah
$$ \Delta I = I(P) - \frac{|L|}{|P|} I(L) - \frac{|R|}{|P|} I(R), $$
di mana (I(\cdot)) bisa berupa Gini, entropi, MSE, atau MAE. Hanya split dengan (\Delta I > 0) yang dipertahankan.
Penyeleksian pohon melalui cost-complexity menilai (T) dengan
$$ R_\alpha(T) = R(T) + \alpha |T|, $$
dengan (R(T)) sebagai loss pelatihan, (|T|) jumlah daun, dan (\alpha \ge 0) penalti ukuran. Semakin besar (\alpha), semakin sederhana pohonnya.
3. Eksperimen Python #
Kode berikut melatih beberapa DecisionTreeRegressor pada data sintetis dan memperlihatkan bagaimana variasi parameter memengaruhi skor (R^2) train/test.
import numpy as np
import matplotlib.pyplot as plt
from sklearn.model_selection import train_test_split
from sklearn.tree import DecisionTreeRegressor
from sklearn.datasets import make_regression
from sklearn.metrics import r2_score

X, y = make_regression(
    n_samples=500,
    n_features=2,
    noise=0.2,
    random_state=42,
)
Xtr, Xte, ytr, yte = train_test_split(X, y, test_size=0.3, random_state=0)

def evaluate(params):
    model = DecisionTreeRegressor(random_state=0, **params).fit(Xtr, ytr)
    r2_train = r2_score(ytr, model.predict(Xtr))
    r2_test = r2_score(yte, model.predict(Xte))
    print(f"{params}: train R2={r2_train:.3f}, test R2={r2_test:.3f}")

evaluate({"max_depth": 3})
evaluate({"max_depth": 10})
evaluate({"max_depth": 5, "min_samples_leaf": 5})
evaluate({"max_depth": 5, "ccp_alpha": 0.01})
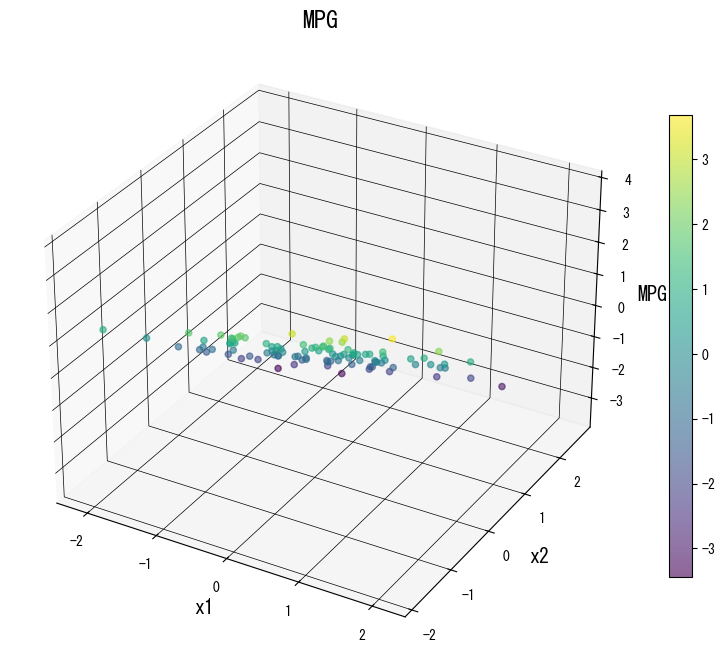
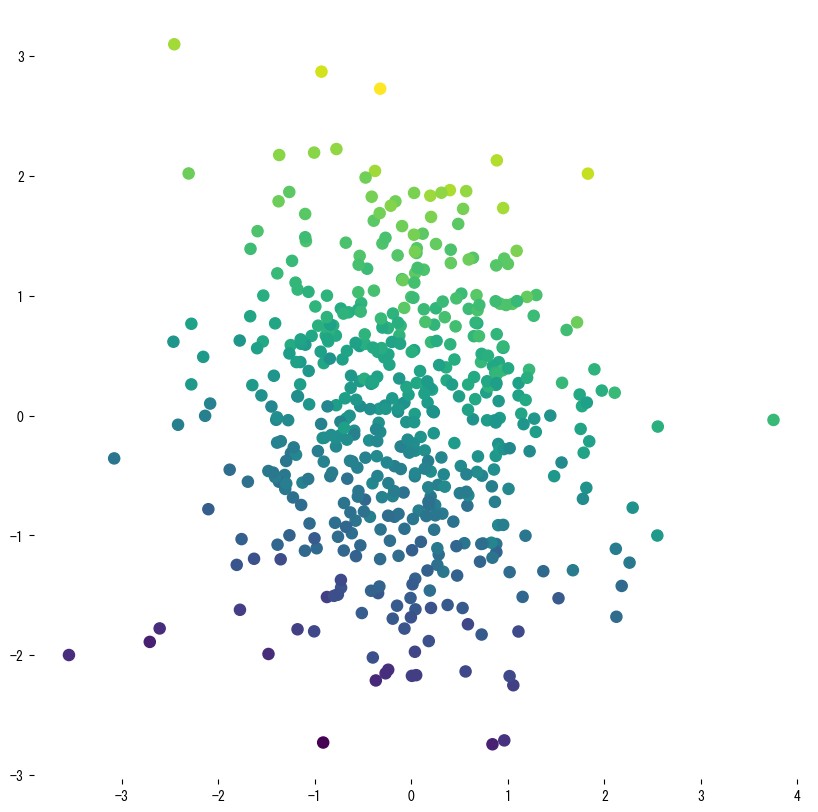
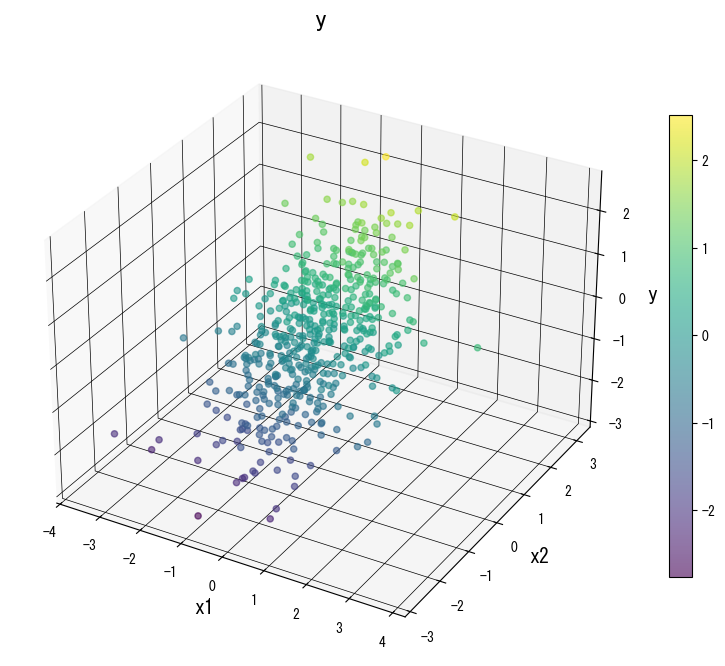
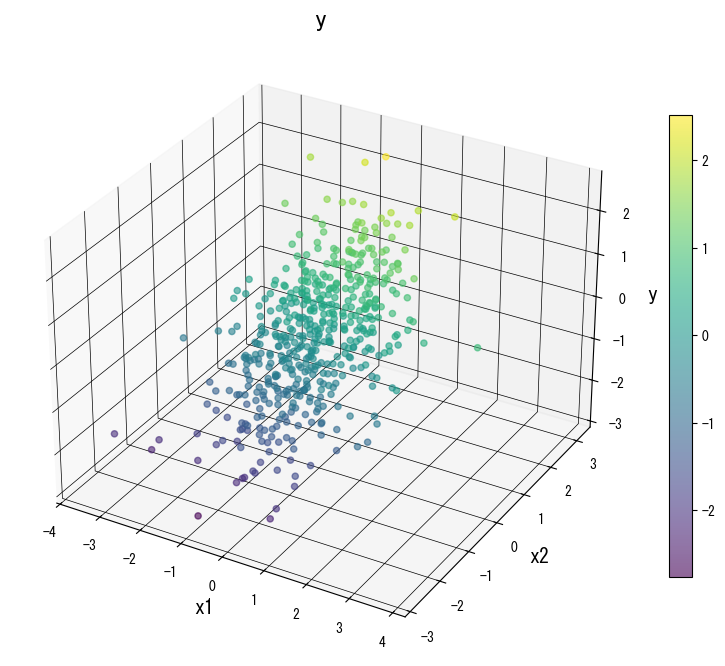
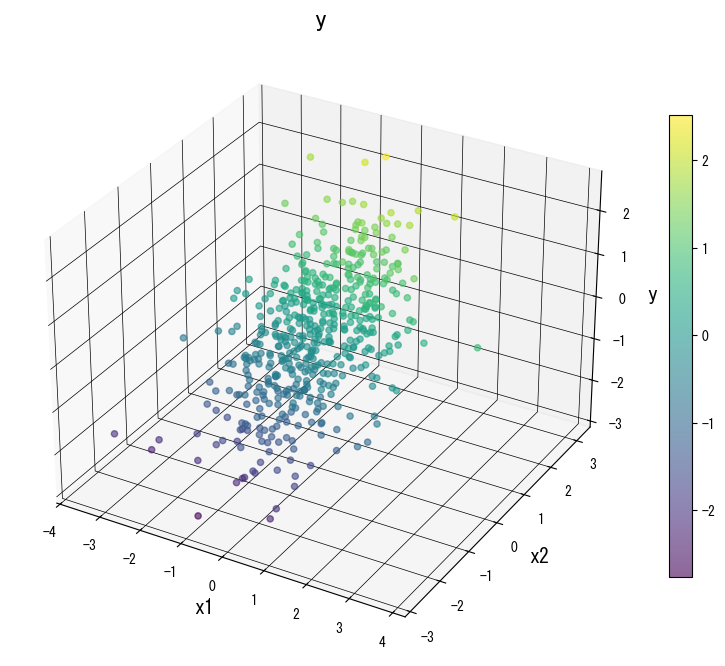
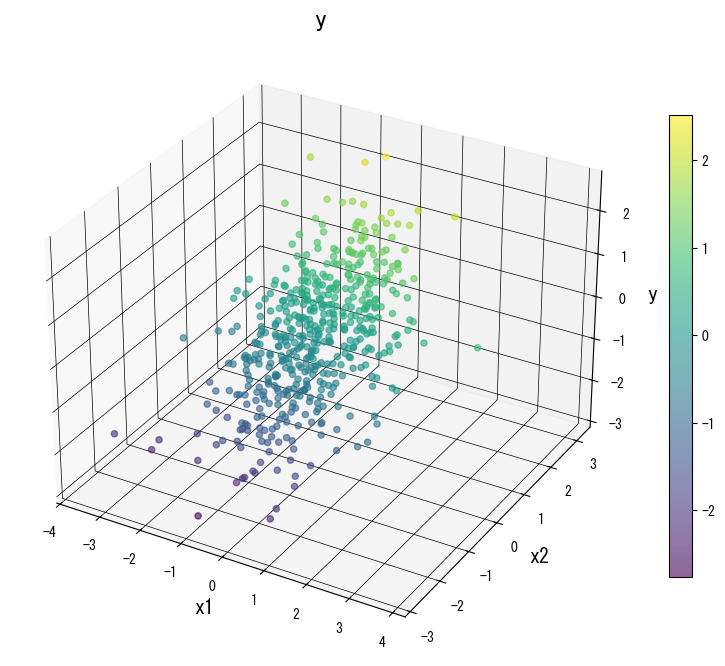
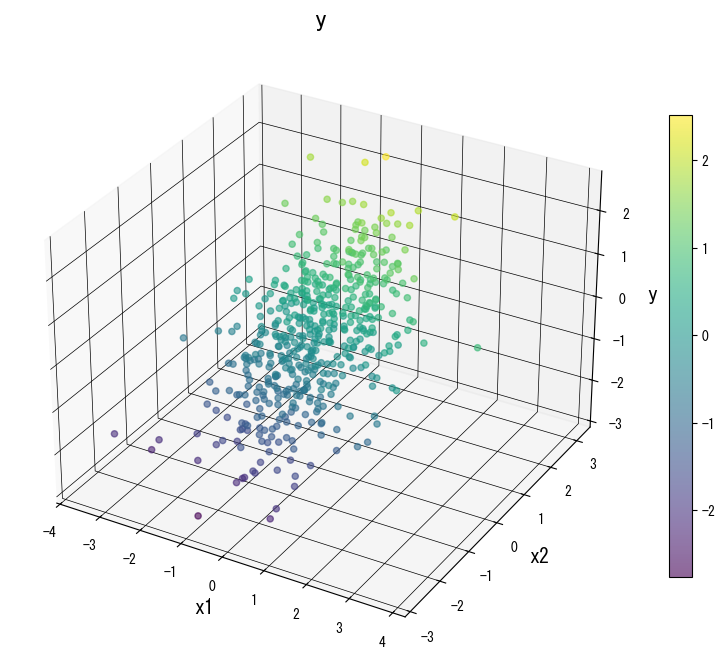
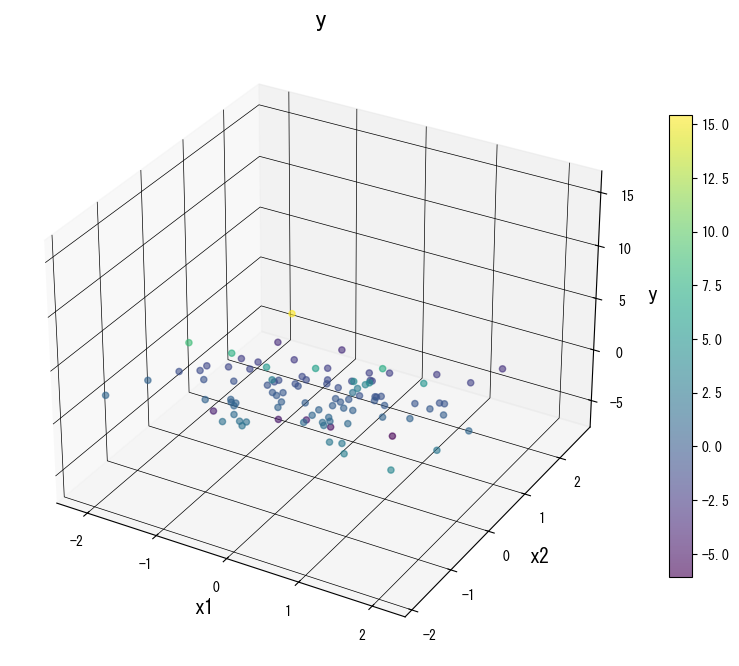
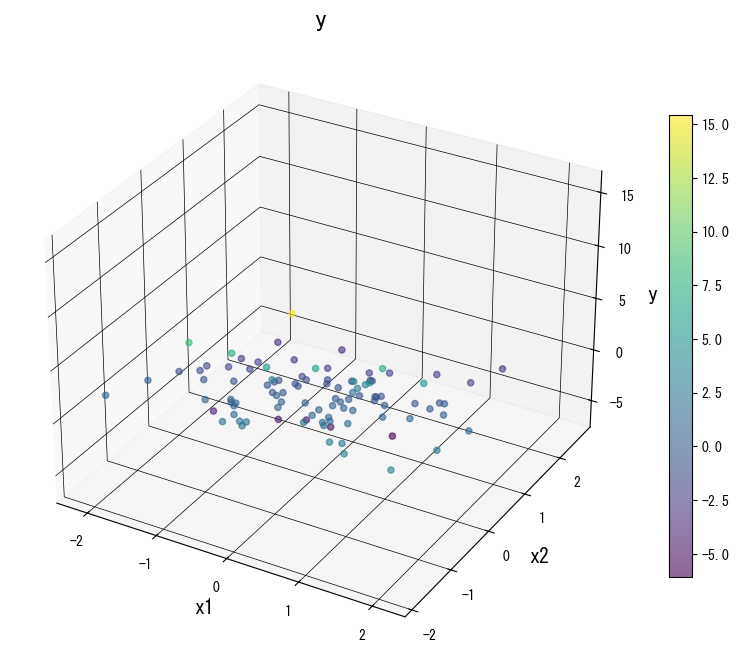
Gunakan galeri berikut sebagai referensi visual saat menala pohon:
4. Referensi #
- Breiman, L., Friedman, J. H., Olshen, R. A., & Stone, C. J. (1984). Classification and Regression Trees. Wadsworth.
- Breiman, L., & Friedman, J. H. (1991). Cost-Complexity Pruning. Dalam Classification and Regression Trees. Chapman & Hall.
- scikit-learn developers. (2024). Decision Trees. https://scikit-learn.org/stable/modules/tree.html