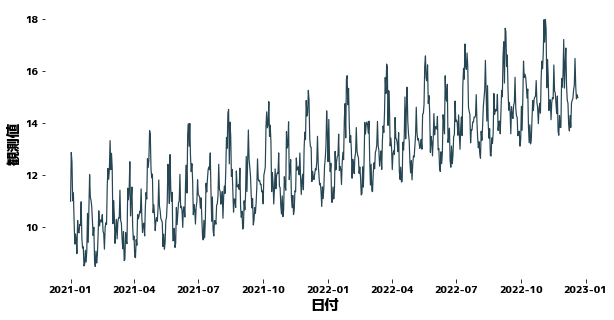
Data deret waktu mengubah bentuk gelombangnya dari waktu ke waktu, tetapi dapat meningkat atau menurun dari waktu ke waktu. Perubahan bertahap dan tidak periodik seperti itu kadang-kadang disebut sebagai tren. Data dengan tren mengubah mean, varians, dan statistik lain dari data dari waktu ke waktu, dan akibatnya lebih sulit untuk diprediksi. Pada halaman ini, kita akan mencoba untuk menghapus komponen tren dari data time series menggunakan python.
import japanize_matplotlib
import pandas as pd
import matplotlib.pyplot as plt
import numpy as np
import seaborn as sns
Menghasilkan data sampel #
date_list = pd.date_range("2021-01-01", periods=720, freq="D")
value_list = [
    10
    + np.cos(np.pi * i / 28.0) * (i % 3 > 0)
    + np.cos(np.pi * i / 14.0) * (i % 5 > 0)
    + np.cos(np.pi * i / 7.0)
    + (i / 10) ** 1.1 / 20
    for i, di in enumerate(date_list)
]

df = pd.DataFrame(
    {
        "日付": date_list,
        "y": value_list,
    }
)

df.head(10)
| 日付 | y | |
|---|---|---|
| 0 | 2021-01-01 | 11.000000 |
| 1 | 2021-01-02 | 12.873581 |
| 2 | 2021-01-03 | 12.507900 |
| 3 | 2021-01-04 | 11.017651 |
| 4 | 2021-01-05 | 11.320187 |
| 5 | 2021-01-06 | 10.246560 |
| 6 | 2021-01-07 | 9.350058 |
| 7 | 2021-01-08 | 9.740880 |
| 8 | 2021-01-09 | 9.539117 |
| 9 | 2021-01-10 | 8.987155 |
plt.figure(figsize=(10, 5))
sns.lineplot(x=df["日付"], y=df["y"])

Memprediksi Data Deret Waktu dengan XGBoost #
df["曜日"] = df["日付"].dt.weekday
df["年初からの日数%14"] = df["日付"].dt.dayofyear % 14
df["年初からの日数%28"] = df["日付"].dt.dayofyear % 28


def get_trend(timeseries, deg=3, trainN=0):
    """Membuat garis tren untuk data deret waktu

    Args:
        timeseries(pd.Series) : Time series data
        deg(int) : Degree of polynomial
        trainN(int): Number of data used to estimate the coefficients of the polynomial

    Returns:
        pd.Series: Time series data corresponding to trends
    """
    if trainN == 0:
        trainN = len(timeseries)

    x = list(range(len(timeseries)))
    y = timeseries.values
    coef = np.polyfit(x[:trainN], y[:trainN], deg)
    trend = np.poly1d(coef)(x)
    return pd.Series(data=trend, index=timeseries.index)


trainN = 500
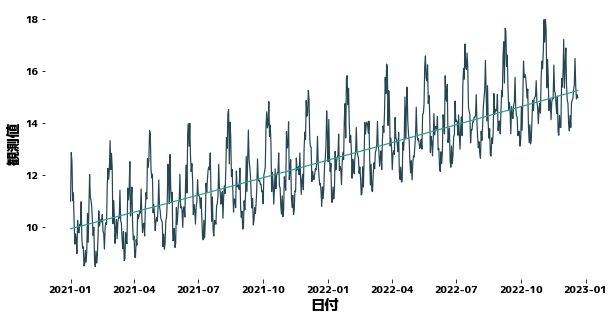
df["Trend"] = get_trend(df["y"], trainN=trainN, deg=2)

plt.figure(figsize=(10, 5))
sns.lineplot(x=df["日付"], y=df["y"])
sns.lineplot(x=df["日付"], y=df["Trend"])

X = df[["曜日", "年初からの日数%14", "年初からの日数%28"]]
y = df["y"]

trainX, trainy = X[:trainN], y[:trainN]
testX, testy = X[trainN:], y[trainN:]
trend_train, trend_test = df["Trend"][:trainN], df["Trend"][trainN:]
Peramalan tanpa mempertimbangkan tren #
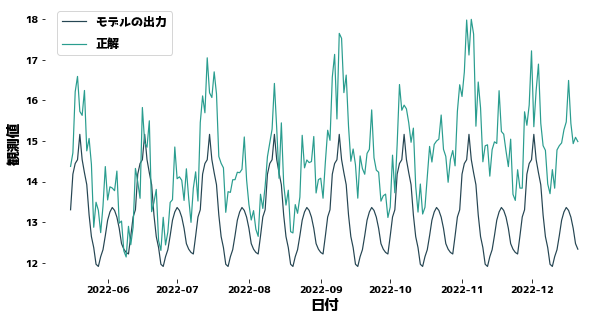
XGBoost tidak tahu bahwa data berubah perlahan antara data pelatihan dan pengujian. Oleh karena itu, semakin banyak Anda memprediksi masa depan, semakin banyak prediksi Anda akan meleset. Agar XGBoost dapat meramalkan dengan baik, distribusi y dari data pelatihan dan pengujian harus dekat.
import xgboost as xgb
from sklearn.metrics import mean_squared_error

regressor = xgb.XGBRegressor(max_depth=5).fit(trainX, trainy)
prediction = regressor.predict(testX)

plt.figure(figsize=(10, 5))
sns.lineplot(x=df["日付"][trainN:], y=prediction)
sns.lineplot(x=df["日付"][trainN:], y=testy)

plt.legend(["モデルの出力", "正解"], bbox_to_anchor=(0.0, 0.78, 0.28, 0.102))
print(f"MSE = {mean_squared_error(testy, prediction)}")
MSE = 2.815118389938834

Predicting with the trend taken into account #
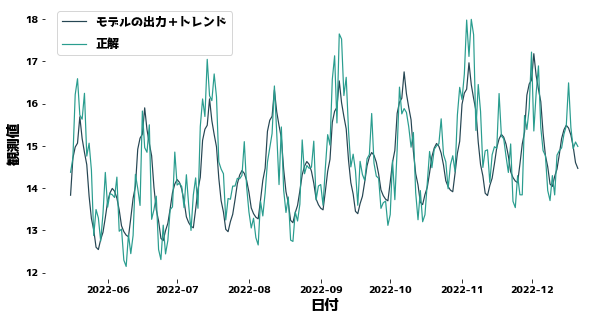
We first remove the portion corresponding to the trend from the observed values and then predict the values without the trend. The XGBoost prediction is then added to the XGBoost prediction to obtain the final prediction.
regressor = xgb.XGBRegressor(max_depth=5).fit(trainX, trainy - trend_train)
prediction = regressor.predict(testX)
prediction = [pred_i + trend_i for pred_i, trend_i in zip(prediction, trend_test)]

plt.figure(figsize=(10, 5))
sns.lineplot(x=df["日付"][trainN:], y=prediction)
sns.lineplot(x=df["日付"][trainN:], y=testy)

plt.legend(["モデルの出力+Trend", "正解"], bbox_to_anchor=(0.0, 0.78, 0.28, 0.102))
print(f"MSE = {mean_squared_error(testy, prediction)}")
MSE = 0.46014173311011325
