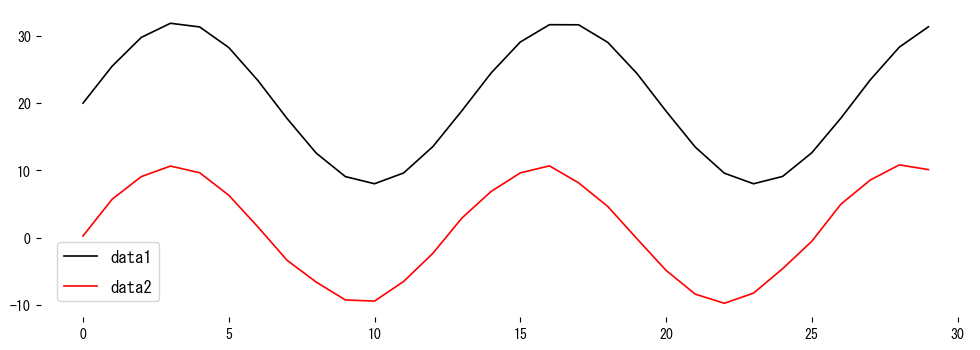
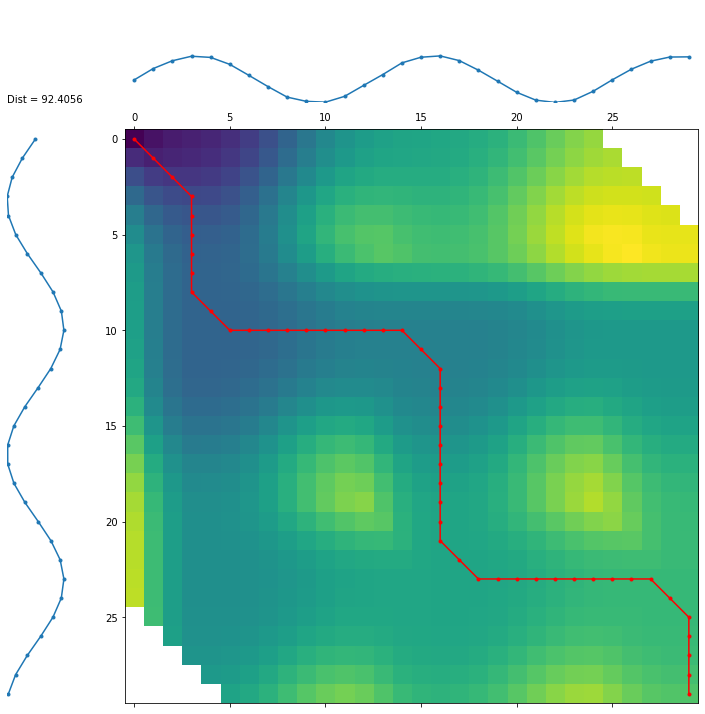
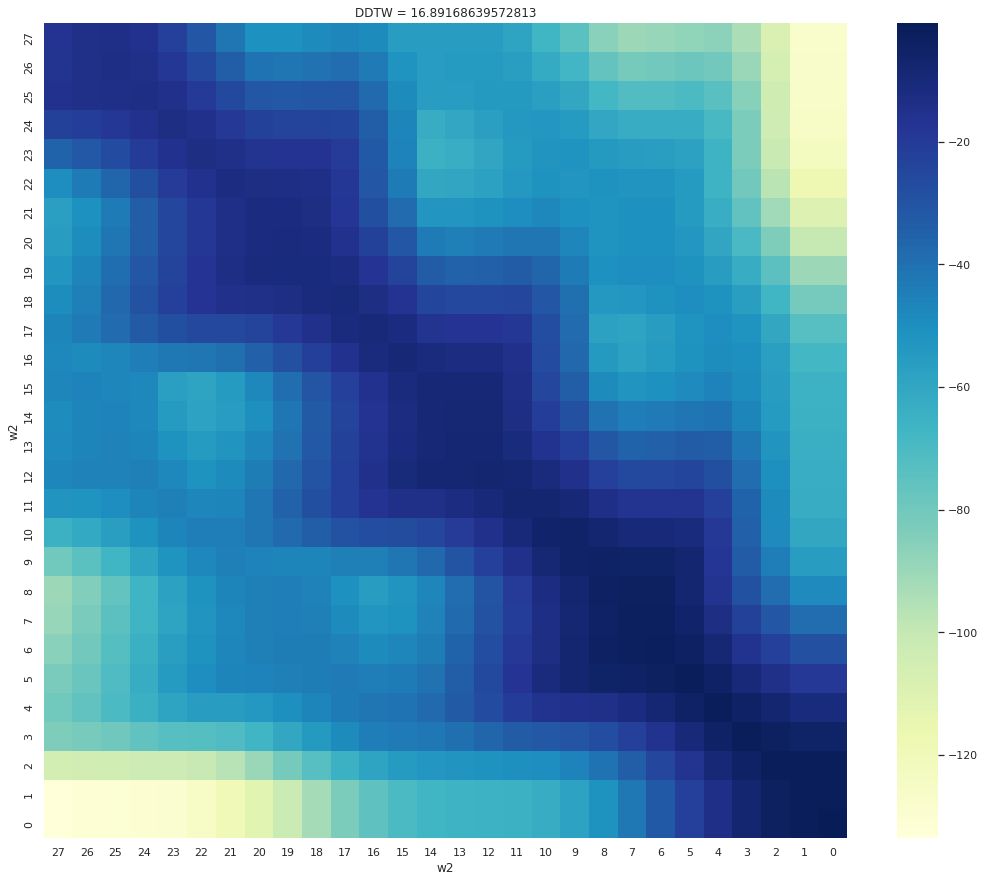
5.13.2DTW dan DDTWDiperbarui 2020-02-12 Baca 1 menit1 2 3 4 5 6 7 8 9 import numpy as np import matplotlib.pyplot as plt import seaborn as sns from dtaidistance import dtw from dtaidistance import dtw_visualisation as dtwvis from utils import DDTW np.random.seed(777) Memplot Dua Gelombang yang Digunakan untuk Eksperimen # 1 2 3 4 5 6 7 8 9 10 data1 = np.array([12.0 * np.sin(i / 2.1) + 20 for i in range(30)]) data2 = np.array([10.0 * np.sin(i / 2.0) + np.random.rand() for i in range(30)]) plt.figure(figsize=(12, 4)) # Memplot gelombang plt.plot(data1, label="data1", color="k") plt.plot(data2, label="data2", color="r") plt.legend() plt.show() DTW #1 2 3 4 5 6 7 d, paths = dtw.warping_paths( data1, data2, window=25, ) best_path = dtw.best_path(paths) dtwvis.plot_warpingpaths(data1, data2, paths, best_path) DDTW # 1 2 3 4 5 6 7 8 9 10 11 γ_mat, arrows, ddtw = DDTW(np.array(data1), np.array(data2)) sns.set(rc={"figure.figsize": (18, 15)}) sns.set(font="IPAexGothic") ax = sns.heatmap(-1 * γ_mat, cmap="YlGnBu") ax.set_title(f"DDTW = {ddtw}") ax.invert_xaxis() ax.invert_yaxis() ax.set_xlabel("w2") ax.set_ylabel("w2") plt.show()