5.13.3
tsfresh
<p>Saat bekerja dengan data deret waktu, sering kali kita menghitung berbagai fitur berdasarkan kolom timestamp dan angka. Halaman ini akan menunjukkan cara menghitung fitur dari data deret waktu menggunakan tsfresh. Selain itu, video ini menjelaskan berbagai perspektif untuk membuat fitur.</p>
tsfresh #
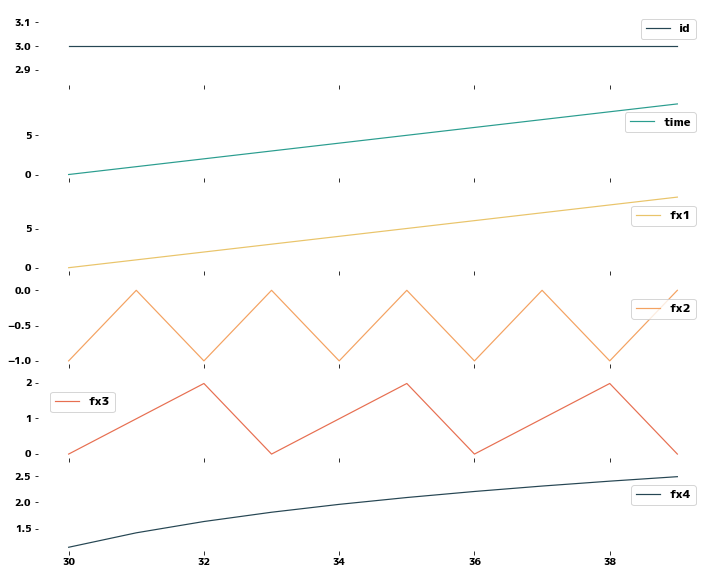
Overview on extracted featuresを参考に、どんな特徴量が作成されるか確認してみます。
| |
| id | time | fx1 | fx2 | fx3 | fx4 | |
|---|---|---|---|---|---|---|
| 0 | 0 | 0 | 0.099833 | 0.995004 | 0.100335 | -2.302585 |
| 1 | 0 | 1 | 1.099833 | 1.995004 | 1.100335 | 0.095310 |
| 2 | 0 | 2 | 2.099833 | 0.995004 | 2.100335 | 0.741937 |
| 3 | 0 | 3 | 3.099833 | 1.995004 | 0.100335 | 1.131402 |
| 4 | 0 | 4 | 4.099833 | 0.995004 | 1.100335 | 1.410987 |
| |
Menghitung Fitur #
Dengan menggunakan fungsi extract_features, Anda dapat menghitung semua fitur sekaligus. Selain itu, Anda juga dapat melakukan seleksi fitur dengan menggunakan fungsi-fungsi yang tersedia di bawah modul tsfresh.feature_selection.
| |
Feature Extraction: 100%|█
| fx1__variance_larger_than_standard_deviation | fx1__has_duplicate_max | fx1__has_duplicate_min | fx1__has_duplicate | fx1__sum_values | fx1__abs_energy | fx1__mean_abs_change | fx1__mean_change | fx1__mean_second_derivative_central | fx1__median | ... | fx4__permutation_entropy__dimension_6__tau_1 | fx4__permutation_entropy__dimension_7__tau_1 | fx4__query_similarity_count__query_None__threshold_0.0 | fx4__matrix_profile__feature_"min"__threshold_0.98 | fx4__matrix_profile__feature_"max"__threshold_0.98 | fx4__matrix_profile__feature_"mean"__threshold_0.98 | fx4__matrix_profile__feature_"median"__threshold_0.98 | fx4__matrix_profile__feature_"25"__threshold_0.98 | fx4__matrix_profile__feature_"75"__threshold_0.98 | fx4__mean_n_absolute_max__number_of_maxima_7 | |
|---|---|---|---|---|---|---|---|---|---|---|---|---|---|---|---|---|---|---|---|---|---|
| 0 | 1.0 | 0.0 | 0.0 | 0.0 | 45.998334 | 294.084675 | 1.0 | 1.0 | -3.469447e-18 | 4.599833 | ... | -0.0 | -0.0 | NaN | NaN | NaN | NaN | NaN | NaN | NaN | 1.915905 |
| 1 | 1.0 | 0.0 | 0.0 | 0.0 | 53.952941 | 373.591982 | 1.0 | 1.0 | -6.938894e-18 | 5.395294 | ... | -0.0 | -0.0 | NaN | NaN | NaN | NaN | NaN | NaN | NaN | 1.918724 |
| 2 | 1.0 | 0.0 | 0.0 | 0.0 | 53.538882 | 369.141186 | 1.0 | 1.0 | 0.000000e+00 | 5.353888 | ... | -0.0 | -0.0 | NaN | NaN | NaN | NaN | NaN | NaN | NaN | 2.062001 |
| 3 | 1.0 | 0.0 | 0.0 | 0.0 | 45.143194 | 286.290800 | 1.0 | 1.0 | -8.673617e-19 | 4.514319 | ... | -0.0 | -0.0 | NaN | NaN | NaN | NaN | NaN | NaN | NaN | 2.186180 |
| 4 | 1.0 | 0.0 | 0.0 | 0.0 | 36.613658 | 216.555992 | 1.0 | 1.0 | 0.000000e+00 | 3.661366 | ... | -0.0 | -0.0 | NaN | NaN | NaN | NaN | NaN | NaN | NaN | 2.295964 |
5 rows × 3156 columns