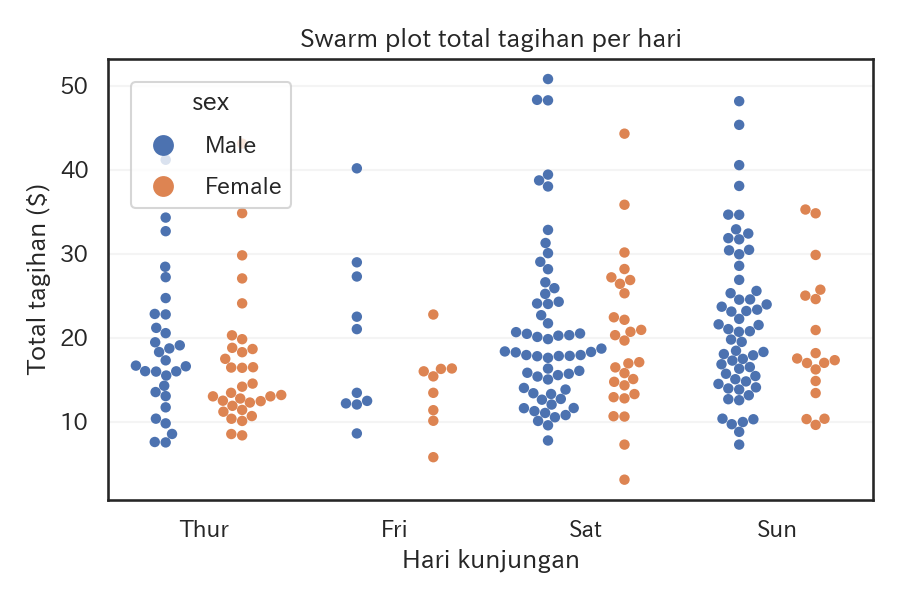
Swarm plot menggeser setiap observasi agar tidak saling menumpuk, sehingga bentuk distribusi terlihat sambil mempertahankan nilai individu.
 1
 2
 3
 4
 5
 6
 7
 8
 9
10
11
12
13
14
15
16
importseabornassnsimportmatplotlib.pyplotasplttips=sns.load_dataset("tips")fig,ax=plt.subplots(figsize=(6,4))sns.swarmplot(data=tips,x="day",y="total_bill",hue="sex",dodge=True,ax=ax)ax.set_xlabel("Hari kunjungan")ax.set_ylabel("Total tagihan ($)")ax.set_title("Swarm plot total tagihan per hari")ax.grid(axis="y",alpha=0.2)fig.tight_layout()plt.show()