+-の変化の表現
import matplotlib.pyplot as plt
import numpy as np
import pandas as pd
from matplotlib.colors import LinearSegmentedColormap
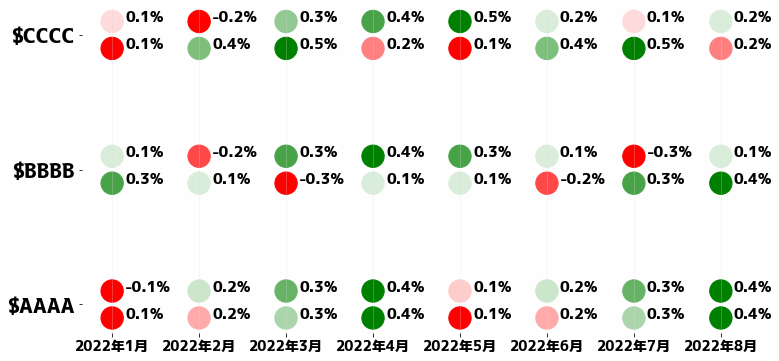
cmap = LinearSegmentedColormap.from_list("rg", ["r", "w", "g"], N=256)
data = {
"$AAAA": {
"EPS": [0.1, 0.2, 0.3, 0.4, 0.1, 0.2, 0.3, 0.4],
"Revenue": [-0.1, 0.2, 0.3, 0.4, 0.1, 0.2, 0.3, 0.4],
},
"$BBBB": {
"EPS": [0.3, 0.1, -0.3, 0.1, 0.1, -0.2, 0.3, 0.4],
"Revenue": [0.1, -0.2, 0.3, 0.4, 0.3, 0.1, -0.3, 0.1],
},
"$CCCC": {
"EPS": [0.1, 0.4, 0.5, 0.2, 0.1, 0.4, 0.5, 0.2],
"Revenue": [0.1, -0.2, 0.3, 0.4, 0.5, 0.2, 0.1, 0.2],
},
}
n_companies = 3
n_times = 8
プロット
y_index = 0
y_label = []

fig = plt.figure(figsize=(12, 6))
ax = plt.gca()
ax.set_facecolor("#fefefe")

for company_name, eps_rev in data.items():
    d = -0.1
    for name, v in eps_rev.items():
        x = np.arange(n_times)
        y = [y_index + d for _ in range(n_times)]
        plt.scatter(x, y, c=v, s=500, cmap=cmap)

        for xi, vi in zip(x, v):
            plt.text(xi + 0.15, y_index + d, f"{vi}%", fontsize=15)
        d += 0.2

    y_label.append(company_name)
    y_index += 1

plt.xticks(
    np.arange(n_times), labels=[f"2022年{m+1}月" for m in np.arange(n_times)], fontsize=14
)
plt.yticks(np.arange(n_companies), labels=y_label, fontsize=20)
plt.grid(axis="x", color="#ddd")