外れ値にラベルを付与②
Isoration Forestは異常検知を行うアルゴリズムの一種であり、データに木構造を割り当てた上でそのデータへの木の当てはまり方によってスコアを計算(外れ値は数が少なく他とは違った箇所に分布しがちなので、早い段階で木が分割されたりそのデータ周辺の決定境界が少なくなりがち)し、異常の度合いを決定するアルゴリズムです。データにこのページでは、IsolationForestを使用してデータに含まれる外れ値にラベルをつけてみます。
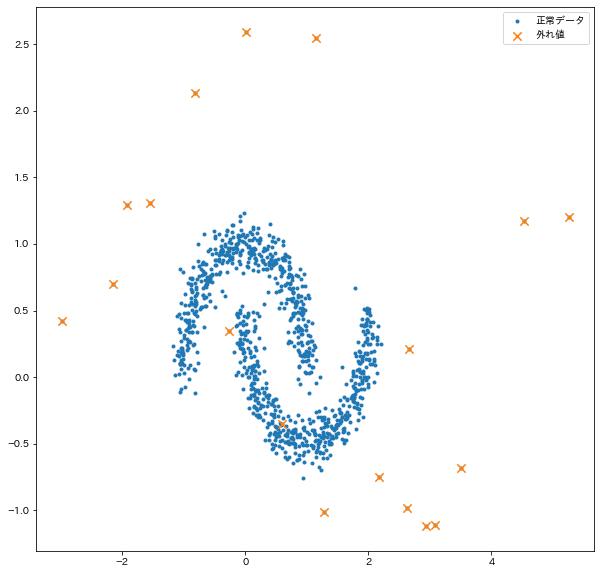
実験用のデータ
from sklearn.datasets import make_moons
import matplotlib.pyplot as plt
import japanize_matplotlib
import numpy as np

np.random.seed(seed=100)
X, y = make_moons(n_samples=1000, noise=0.1)

# 外れ値のインデックス
anom_ind = [i * 50 for i in range(18)]
for an_i in anom_ind:
    X[an_i] *= 2.5


# プロットして確認
plt.figure(figsize=(10, 10))
plt.scatter(X[:, 0], X[:, 1], marker=".", label="正常データ")
plt.scatter(X[:, 0][anom_ind], X[:, 1][anom_ind], marker="x", s=70, label="外れ値")
plt.legend()
plt.show()
外れ値を検出する
contamination‘auto’ or float, default=’auto’
The amount of contamination of the data set, i.e. the proportion of outliers in the data set. Used when fitting to define the threshold on the scores of the samples.
contaminationパラメタより、外れ値として検出する割合を指定する。
from sklearn.ensemble import IsolationForest

clf = IsolationForest(
    n_estimators=20, max_samples=200, random_state=100, contamination=0.015
)
clf.fit(X)
detected_anom_index_train = np.where(clf.predict(X) < 0)
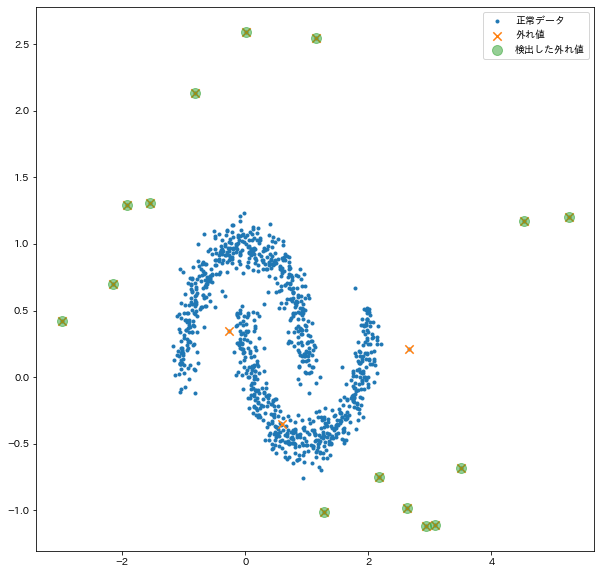
実際に検出できたかを確認する
# プロットして確認
plt.figure(figsize=(10, 10))
plt.scatter(X[:, 0], X[:, 1], marker=".", label="正常データ")
plt.scatter(X[:, 0][anom_ind], X[:, 1][anom_ind], marker="x", s=70, label="外れ値")
plt.scatter(
    X[:, 0][detected_anom_index_train],
    X[:, 1][detected_anom_index_train],
    marker="o",
    s=100,
    label="検出した外れ値",
    alpha=0.5,
)
plt.legend()
plt.show()