トレンドの除去
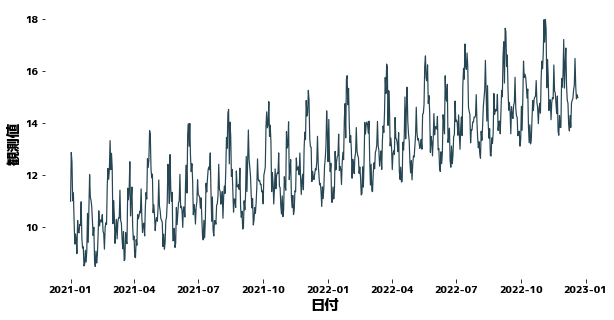
時系列データは時間とともに波形が変化しますが、時間経過とともに増加をしたり減少したりします。このような、周期的ではない緩やかな変化をトレンドと呼ぶことがあります。 トレンドがあるデータは時間によってデータの平均値や分散などの統計量が変化し、その結果として予測が難しくなります。 このページでは、pythonを使って時系列データからトレンド成分を取り除いてみます。
import japanize_matplotlib
import pandas as pd
import matplotlib.pyplot as plt
import numpy as np
import seaborn as sns
サンプルデータを作成
date_list = pd.date_range("2021-01-01", periods=720, freq="D")
value_list = [
    10
    + np.cos(np.pi * i / 28.0) * (i % 3 > 0)
    + np.cos(np.pi * i / 14.0) * (i % 5 > 0)
    + np.cos(np.pi * i / 7.0)
    + (i / 10) ** 1.1 / 20
    for i, di in enumerate(date_list)
]

df = pd.DataFrame(
    {
        "日付": date_list,
        "観測値": value_list,
    }
)

df.head(10)
| 日付 | 観測値 | |
|---|---|---|
| 0 | 2021-01-01 | 11.000000 |
| 1 | 2021-01-02 | 12.873581 |
| 2 | 2021-01-03 | 12.507900 |
| 3 | 2021-01-04 | 11.017651 |
| 4 | 2021-01-05 | 11.320187 |
| 5 | 2021-01-06 | 10.246560 |
| 6 | 2021-01-07 | 9.350058 |
| 7 | 2021-01-08 | 9.740880 |
| 8 | 2021-01-09 | 9.539117 |
| 9 | 2021-01-10 | 8.987155 |
plt.figure(figsize=(10, 5))
sns.lineplot(x=df["日付"], y=df["観測値"])

XGBoostで時系列データを予測してみる
df["曜日"] = df["日付"].dt.weekday
df["年初からの日数%14"] = df["日付"].dt.dayofyear % 14
df["年初からの日数%28"] = df["日付"].dt.dayofyear % 28


def get_trend(timeseries, deg=3, trainN=0):
    """時系列データのトレンドの線を作成する

    Args:
        timeseries(pd.Series) : 時系列データ。
        deg(int) : 多項式の次数
        trainN(int): 多項式の係数を推定するために使用するデータ数

    Returns:
        pd.Series: トレンドに相当する時系列データ。
    """
    if trainN == 0:
        trainN = len(timeseries)

    x = list(range(len(timeseries)))
    y = timeseries.values
    coef = np.polyfit(x[:trainN], y[:trainN], deg)
    trend = np.poly1d(coef)(x)
    return pd.Series(data=trend, index=timeseries.index)


trainN = 500
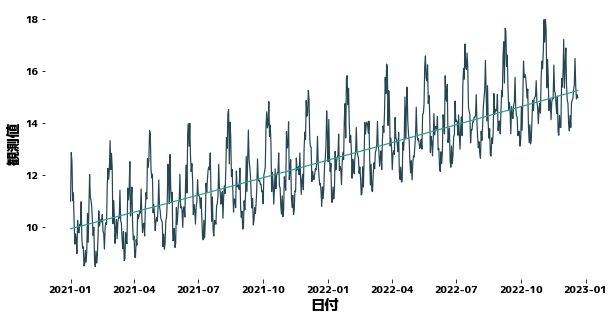
df["トレンド"] = get_trend(df["観測値"], trainN=trainN, deg=2)

plt.figure(figsize=(10, 5))
sns.lineplot(x=df["日付"], y=df["観測値"])
sns.lineplot(x=df["日付"], y=df["トレンド"])

X = df[["曜日", "年初からの日数%14", "年初からの日数%28"]]
y = df["観測値"]

trainX, trainy = X[:trainN], y[:trainN]
testX, testy = X[trainN:], y[trainN:]
trend_train, trend_test = df["トレンド"][:trainN], df["トレンド"][trainN:]
トレンドを考慮せずに予測する
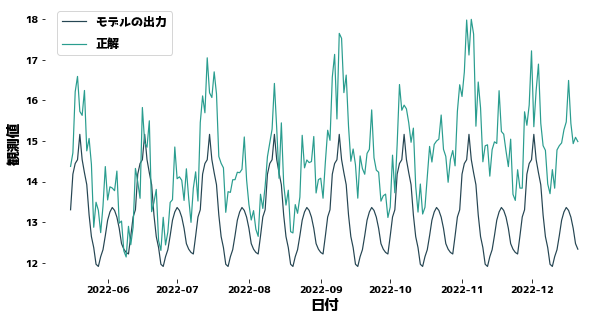
XGBoostは訓練データとテストデータでデータが緩やかに変化していることを知りません。 そのため、未来を予測するほど予測が下に外れてしまいます。 XGBoostで予測をうまく行うには、訓練データとテストデータのyの分布を近くする必要があります。
トレンドは特徴量にも含まれているかもしれません。 与えられた入力に対する出力の生成規則が訓練データとテストデータで変わらないものの、 入力の分布が訓練データとテストデータで異なる状態は共変量シフト(covariate shift)とも呼ばれます。
import xgboost as xgb
from sklearn.metrics import mean_squared_error

regressor = xgb.XGBRegressor(max_depth=5).fit(trainX, trainy)
prediction = regressor.predict(testX)

plt.figure(figsize=(10, 5))
sns.lineplot(x=df["日付"][trainN:], y=prediction)
sns.lineplot(x=df["日付"][trainN:], y=testy)

plt.legend(["モデルの出力", "正解"], bbox_to_anchor=(0.0, 0.78, 0.28, 0.102))
print(f"誤差(MSE) = {mean_squared_error(testy, prediction)}")
誤差(MSE) = 2.815118389938834

トレンドを考慮して予測する
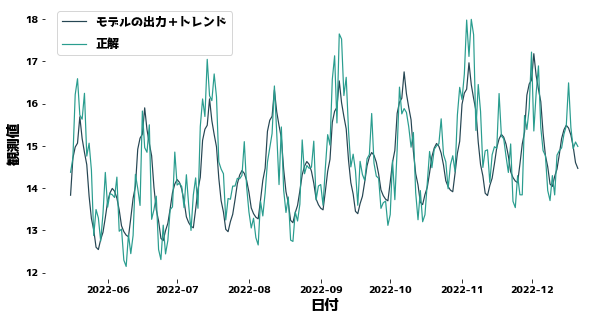
先にトレンドに相当する分を観測値から取り除いて、トレンドがない状態の数値を予測します。 トレンドを取り除きさえすれば、訓練データとテストデータでのyの分布は同じものになり、XGBoostでの予測がうまくいくことが予想されます。XGBoostの予測値にトレンドに相当する分を足して最終的な予測値としています。
regressor = xgb.XGBRegressor(max_depth=5).fit(trainX, trainy - trend_train)
prediction = regressor.predict(testX)
prediction = [pred_i + trend_i for pred_i, trend_i in zip(prediction, trend_test)]

plt.figure(figsize=(10, 5))
sns.lineplot(x=df["日付"][trainN:], y=prediction)
sns.lineplot(x=df["日付"][trainN:], y=testy)

plt.legend(["モデルの出力+トレンド", "正解"], bbox_to_anchor=(0.0, 0.78, 0.28, 0.102))
print(f"誤差(MSE) = {mean_squared_error(testy, prediction)}")
誤差(MSE) = 0.46014173311011325
