2.9.1
การตรวจจับความผิดปกติ ①
- สรุปเป้าหมาย สมมติฐาน และเงื่อนไขที่เหมาะสมของวิธีนี้.
- ตรวจสอบว่ากฎการอัปเดตหรือเกณฑ์การแบ่งส่งผลต่อพฤติกรรมโมเดลอย่างไร.
- ใช้ตัวอย่างโค้ดเพื่อกำหนดแนวทางปรับพารามิเตอร์อย่างเป็นรูปธรรม.
สัญชาตญาณ #
การตรวจจับความผิดปกติ ① ควรเข้าใจผ่านสมมติฐาน กลไกการปรับปรุงโมเดล และรูปแบบความผิดพลาดบนข้อมูลจริง เพื่อให้เลือกโมเดลและปรับพารามิเตอร์ได้อย่างเหมาะสม.
คำอธิบายโดยละเอียด #
1. เตรียมข้อมูลทดลอง #
ในตัวอย่างนี้ใช้ข้อมูลจาก Numenta Anomaly Benchmark (NAB)
และทดลองด้วย ADTK (Anomaly Detection Toolkit)
| |
| |
2. วิธีตรวจจับที่ใช้บ่อย #
ADTK มีตัวตรวจจับหลายแบบ ที่นี่เลือก 5 วิธีหลักมาเปรียบเทียบ
| |
3. แนวคิดและสมการของแต่ละวิธี #
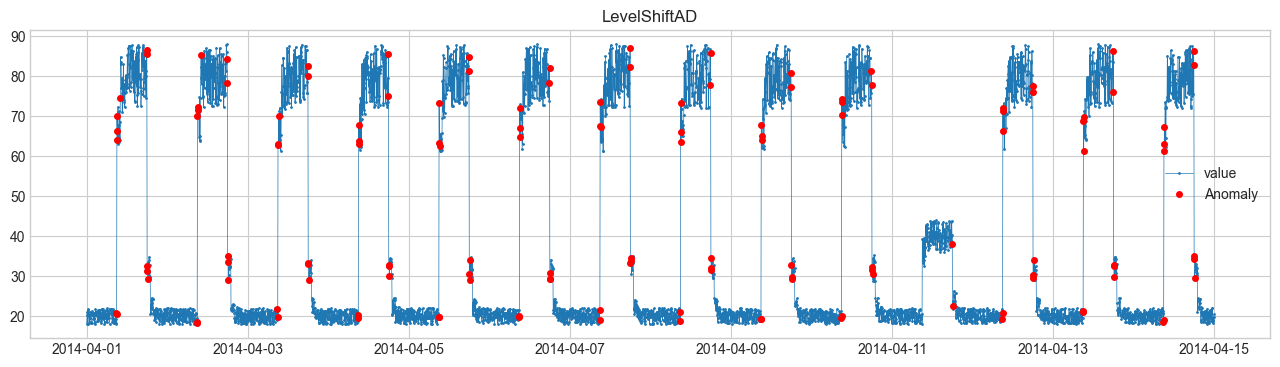
(1) LevelShiftAD (การเปลี่ยนระดับ) #
ตรวจว่าค่าเฉลี่ยเปลี่ยนฉับพลันหรือไม่
เช่น ค่าเซนเซอร์กระโดดขึ้นหรือลงแบบทันที
ถ้า \(|\Delta_t|\) ใหญ่พอ → ถือเป็นความผิดปกติ
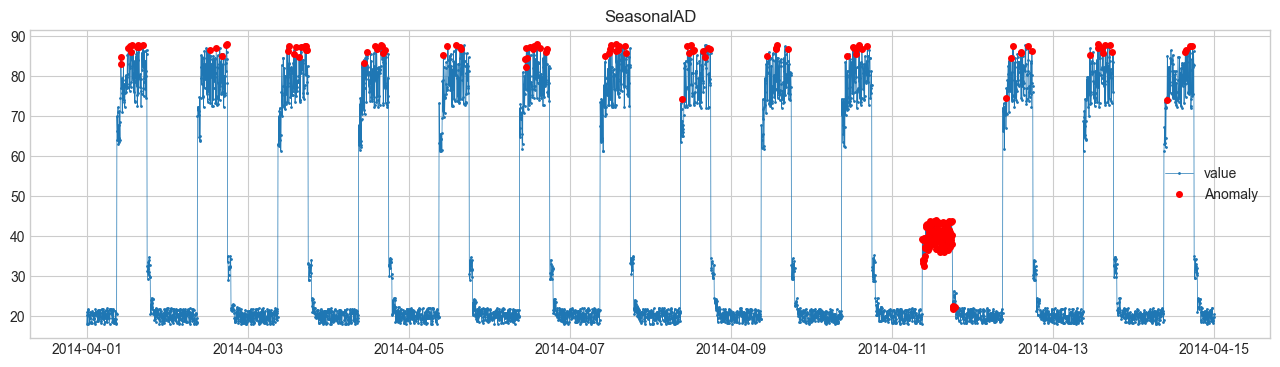
(2) SeasonalAD (เบี่ยงจากฤดูกาล) #
เรียนรู้รูปแบบตามคาบ แล้วตรวจจุดที่เบี่ยงจากรูปแบบนั้น
เช่น จำนวนผู้ใช้งานรายวันที่พุ่งสูงผิดปกติ
ถ้า \(e_t\) ใหญ่ → ผิดปกติ
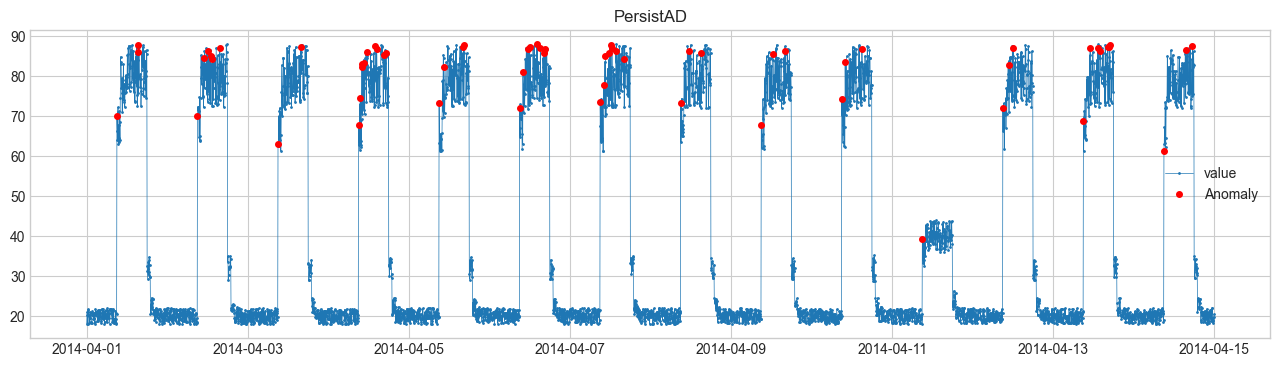
(3) PersistAD (ค่าคงค้างผิดปกติ) #
ดูว่าแตกต่างจากค่าก่อนหน้ามากเกินไปหรือไม่
$$ |x_t - x_{t-1}| > c \cdot \sigma $$ถ้าเกิน \(c\) → ผิดปกติ
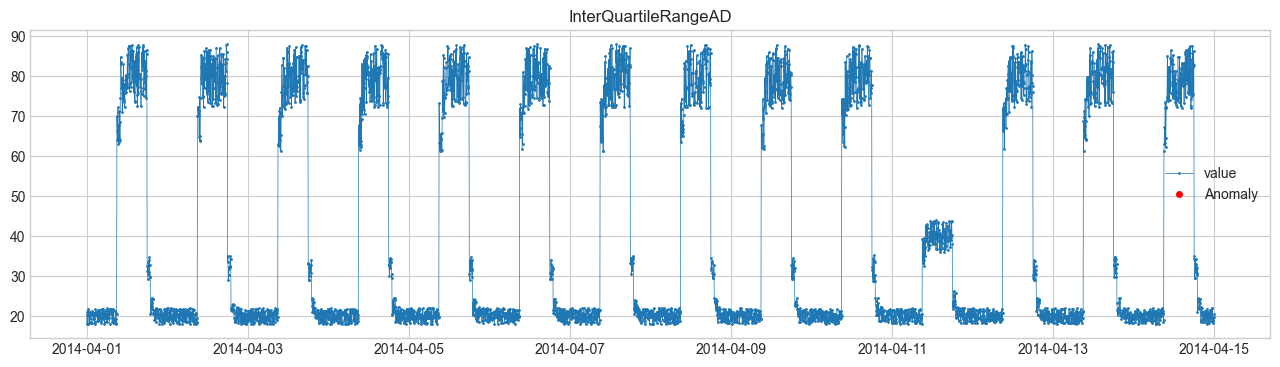
(4) InterQuartileRangeAD (ช่วงควอไทล์) #
ตรวจ outlier ด้วยสถิติ
ใช้ควอไทล์ที่ 1 \(Q1\), ควอไทล์ที่ 3 \(Q3\) และช่วงควอไทล์ \(IQR=Q3-Q1\)
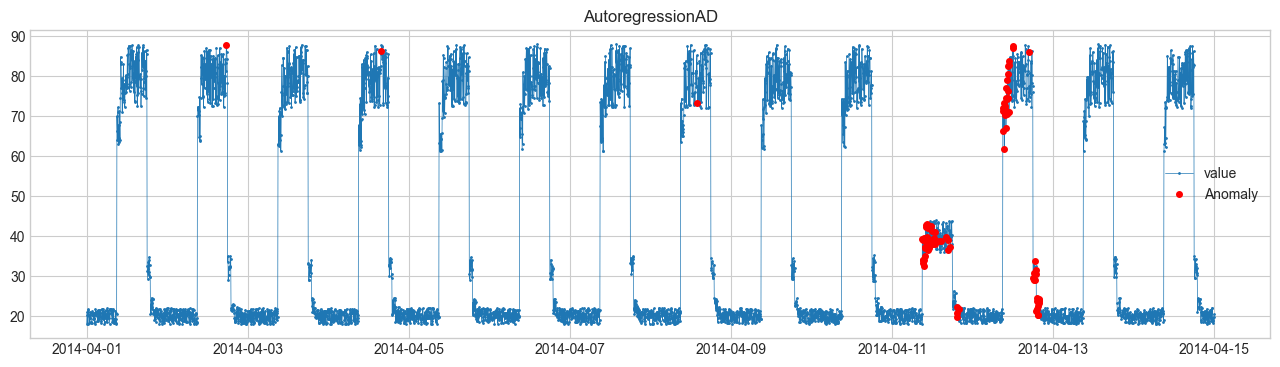
(5) AutoregressionAD (ออโตเรเกรสชัน) #
พยากรณ์อนาคตจากอดีต แล้วดูค่าคลาดเคลื่อน
$$ x_t \approx \sum_{i=1}^p \phi_i x_{t-i} + \epsilon_t $$ถ้าเศษเหลือ \(\epsilon_t\) ใหญ่ → ผิดปกติ
4. ผลการแสดงผล #