まとめ
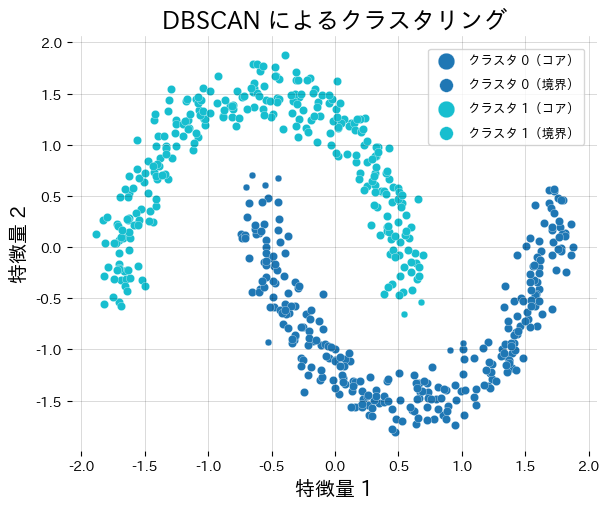
- DBSCAN (Density-Based Spatial Clustering of Applications with Noise) มองพื้นที่ที่แน่นเป็นคลัสเตอร์ ส่วนที่เบาบางเป็น noise
- ต้องกำหนดระยะ
epsและจำนวนเพื่อนบ้านขั้นต่ำmin_samplesเพื่อจัดประเภทจุดเป็น core / border / noise - ไม่ต้องกำหนดจำนวนคลัสเตอร์ล่วงหน้าและรองรับรูปทรงคลัสเตอร์ที่โค้งงอหรือซับซ้อนได้ดี
- ใช้กราฟ
min_samples-distance เพื่อเลือกepsและควรปรับสเกลฟีเจอร์ให้เทียบเคียงกันเพื่อผลลัพธ์ที่เสถียร
ภาพรวมเชิงสัญชาติญาณ #
DBSCAN ตรวจว่า “รอบๆ จุดนี้มีเพื่อนมากพอหรือไม่”
- Core point: มีจุดในรัศมี
epsอย่างน้อยmin_samplesจุด - Border point: อยู่ใกล้ core แต่ตนเองมีเพื่อนน้อยกว่าเกณฑ์
- Noise: ไม่ใช่ทั้ง core และ border
core ที่เชื่อมถึงกันจะอยู่คลัสเตอร์เดียวกัน ส่วน border จะเกาะตามคลัสเตอร์ของ core ที่อยู่ใกล้ที่สุด ส่วน noise ถูกละไว้
สูตรสำคัญ #
กำหนดชุดข้อมูล \(\mathcal{X}\) และระยะ \(\varepsilon\) ใกล้เคียงของจุด \(x_i\) คือ
$$ \mathcal{N}_\varepsilon(x_i) = {, x_j \in \mathcal{X} \mid \lVert x_i - x_j \rVert \le \varepsilon ,}. $$
หาก \(|\mathcal{N}_\varepsilon(x_i)| \ge \texttt{min_samples}\) จะเป็น core point เมื่อ core สองจุดเชื่อมถึงกัน (density reachable) จะถูกจัดอยู่คลัสเตอร์เดียว
ทดลองด้วย Python #
ตัวอย่างต่อไปนี้รัน DBSCAN บนข้อมูลรูปร่างพระจันทร์และรายงานจำนวนคลัสเตอร์/จำนวน noise
from __future__ import annotations
import japanize_matplotlib
import matplotlib.pyplot as plt
import numpy as np
from numpy.typing import NDArray
from sklearn.cluster import DBSCAN
from sklearn.datasets import make_moons
from sklearn.preprocessing import StandardScaler
def run_dbscan_demo(
n_samples: int = 600,
noise: float = 0.08,
eps: float = 0.3,
min_samples: int = 10,
random_state: int = 0,
) -> dict[str, int]:
"""DBSCAN で月型データをクラスタリングし、クラスタ数とノイズ点を調べる."""
japanize_matplotlib.japanize()
features, _ = make_moons(
n_samples=n_samples,
noise=noise,
random_state=random_state,
)
features = StandardScaler().fit_transform(features)
model = DBSCAN(eps=eps, min_samples=min_samples)
labels = model.fit_predict(features)
unique_labels = sorted(np.unique(labels))
cluster_ids = [label for label in unique_labels if label != -1]
noise_count = int(np.sum(labels == -1))
core_mask = np.zeros(labels.shape[0], dtype=bool)
if hasattr(model, "core_sample_indices_"):
core_mask[model.core_sample_indices_] = True
fig, ax = plt.subplots(figsize=(6.2, 5.2))
palette = plt.cm.get_cmap("tab10", max(len(cluster_ids), 1))
for order, cluster_id in enumerate(cluster_ids):
mask = labels == cluster_id
color = palette(order)
ax.scatter(
features[mask & core_mask, 0],
features[mask & core_mask, 1],
c=[color],
s=36,
edgecolor="white",
linewidth=0.2,
label=f"คลัสเตอร์ {cluster_id} (core)",
)
ax.scatter(
features[mask & ~core_mask, 0],
features[mask & ~core_mask, 1],
c=[color],
s=24,
edgecolor="white",
linewidth=0.2,
marker="o",
label=f"คลัสเตอร์ {cluster_id} (border)",
)
if noise_count:
noise_mask = labels == -1
ax.scatter(
features[noise_mask, 0],
features[noise_mask, 1],
c="#9ca3af",
marker="x",
s=28,
linewidth=0.8,
label="Noise",
)
ax.set_title("DBSCAN บนข้อมูลรูปพระจันทร์")
ax.set_xlabel("คุณลักษณะที่ 1")
ax.set_ylabel("คุณลักษณะที่ 2")
ax.grid(alpha=0.2)
ax.legend(loc="upper right", fontsize=9)
fig.tight_layout()
plt.show()
return {"n_clusters": len(cluster_ids), "n_noise": noise_count}
result = run_dbscan_demo()
print(f"จำนวนคลัสเตอร์ที่ค้นพบ: {result['n_clusters']}")
print(f"จำนวนจุด noise: {result['n_noise']}")

เอกสารอ้างอิง #
- Ester, M., Kriegel, H.-P., Sander, J., & Xu, X. (1996). A Density-Based Algorithm for Discovering Clusters in Large Spatial Databases with Noise. KDD.
- Schubert, E., Sander, J., Ester, M., Kriegel, H.-P., & Xu, X. (2017). DBSCAN Revisited, Revisited. ACM Transactions on Database Systems.
- scikit-learn developers. (2024). Clustering. https://scikit-learn.org/stable/modules/clustering.html