まとめ
- k-means ยึดแนวคิดง่ายๆ “จุดที่อยู่ใกล้กันควรอยู่กลุ่มเดียวกัน” โดยอัปเดตจุดศูนย์กลาง (centroid) สลับกับการจัดกลุ่มข้อมูลให้ได้ \(k\) คลัสเตอร์
- ฟังก์ชันวัตถุประสงค์คือผลรวมระยะกำลังสองระหว่างตัวอย่างกับเซนทรอยด์ของมัน (WCSS) เราพยายามทำให้ค่านี้ต่ำสุด
scikit-learnมีKMeansให้ทดลองได้สะดวก สามารถดูการลู่เข้าของ WCSS หรือความเปลี่ยนแปลงของการจัดกลุ่มได้- การเลือกจำนวนคลัสเตอร์ \(k\) มักใช้ elbow method, silhouette score หรือพิจารณาร่วมกับบริบทธุรกิจ
ภาพรวมเชิงสัญชาติญาณ #
k-means ทำงานแบบวนซ้ำ:
- กำหนดจำนวนคลัสเตอร์ \(k\) และเลือกเซนทรอยด์เริ่มต้น
- จัดสรรตัวอย่างให้คลัสเตอร์ที่เซนทรอยด์ใกล้ที่สุด
- คำนวณเซนทรอยด์ใหม่เป็นค่าเฉลี่ยของสมาชิก
- ทำขั้นตอน 2–3 จนเซนทรอยด์แทบไม่ขยับ
เซนทรอยด์ตีความได้ว่าเป็น “จุดศูนย์ถ่วง” ของคลัสเตอร์ จึงไวต่อการสุ่มเริ่มต้นและ outlier ควรสุ่มหลายครั้งหรือทำ preprocessing ให้ดี
สูตรสำคัญ #
ให้ข้อมูล \(\mathcal{X} = {x_1,\ldots,x_n}\) แบ่งออกเป็น \(k\) คลัสเตอร์ \({C_1,\ldots,C_k}\) k-means แก้ปัญหา
$$ \min_{C_1,\dots,C_k} \sum_{j=1}^{k} \sum_{x_i \in C_j} \lVert x_i - \mu_j \rVert^2, $$
โดย \(\mu_j = \frac{1}{|C_j|} \sum_{x_i \in C_j} x_i\) คือเซนทรอยด์ของคลัสเตอร์ที่ \(j\) เป้าหมายคือทำให้ระยะกำลังสองรวมต่ำที่สุด
ทดลองด้วย Python #
ด้านล่างเป็นโน้ตบุ๊ก mini-showcase สำหรับ k-means
1. สร้างข้อมูลและเลือกเซนทรอยด์เริ่มต้น #
from __future__ import annotations

import japanize_matplotlib
import matplotlib.pyplot as plt
import numpy as np
from sklearn.datasets import make_blobs


def generate_dataset(
    n_samples: int = 1000,
    random_state: int = 117_117,
    cluster_std: float = 1.5,
    n_centers: int = 8,
) -> tuple[np.ndarray, np.ndarray]:
    """สร้างข้อมูลสังเคราะห์สำหรับสาธิต k-means"""
    return make_blobs(
        n_samples=n_samples,
        random_state=random_state,
        cluster_std=cluster_std,
        centers=n_centers,
    )


def choose_initial_centroids(
    data: np.ndarray,
    n_clusters: int,
    threshold: float = -8.0,
) -> np.ndarray:
    """เลือกเซนทรอยด์เริ่มต้นแบบกำหนดเอง (ตัวอย่างเพื่อการสาธิต)"""
    mask = data[:, 1] < threshold
    candidates = data[mask]
    if len(candidates) < n_clusters:
        raise ValueError("ตัวเลือกด้านล่าง threshold มีไม่พอ")
    return candidates[:n_clusters]


def plot_initial_configuration(
    data: np.ndarray,
    centroids: np.ndarray,
    figsize: tuple[float, float] = (7.5, 7.5),
) -> None:
    """แสดงข้อมูลดิบและจุดเริ่มต้นของเซนทรอยด์"""
    japanize_matplotlib.japanize()
    fig, ax = plt.subplots(figsize=figsize)
    ax.scatter(data[:, 0], data[:, 1], c="#4b5563", marker="x", label="ข้อมูล")
    ax.scatter(
        centroids[:, 0],
        centroids[:, 1],
        c="#ef4444",
        marker="o",
        s=80,
        label="เซนทรอยด์เริ่มต้น",
    )
    ax.set_title("ข้อมูลและตำแหน่งเซนทรอยด์เริ่มต้น")
    ax.legend(loc="best")
    ax.grid(alpha=0.2)
    fig.tight_layout()
    plt.show()
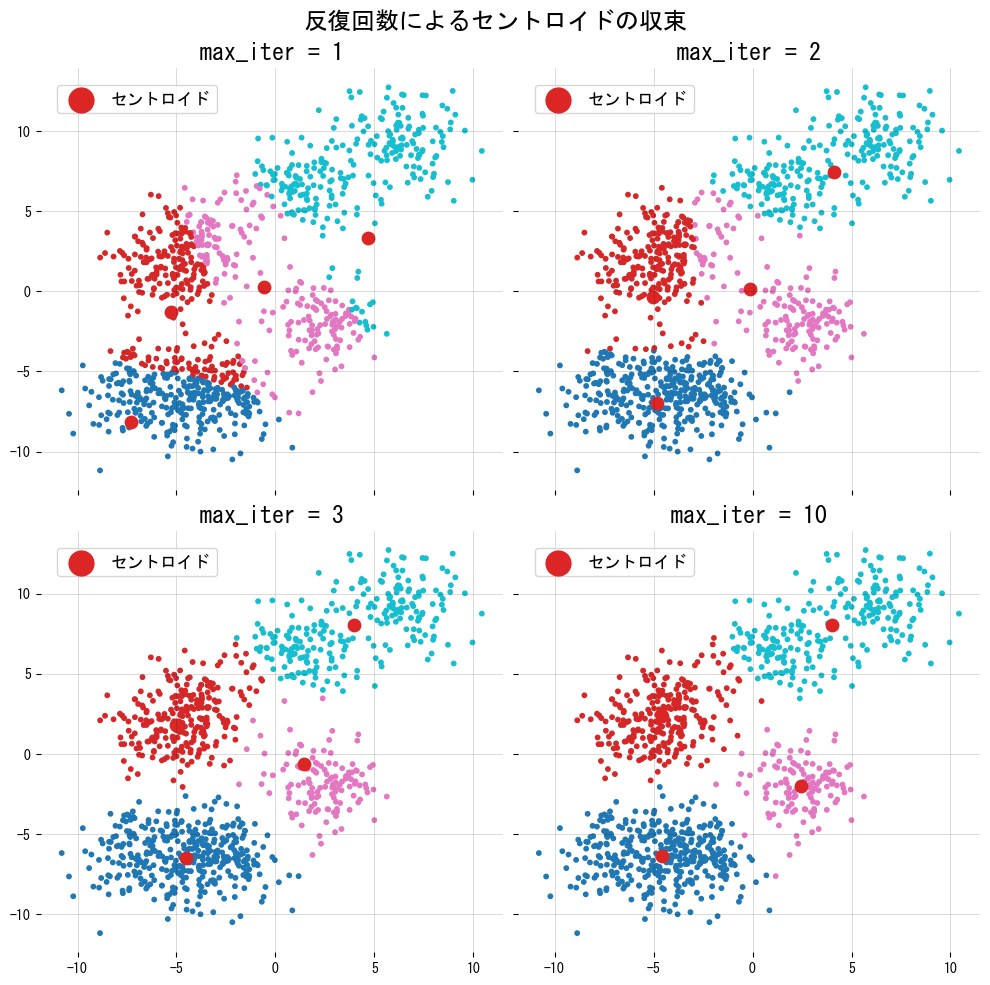
2. ดูการลู่เข้ากับจำนวนรอบต่างๆ #
from collections import OrderedDict
from typing import Sequence

from sklearn.cluster import KMeans

DATASET_X, _ = generate_dataset()
INITIAL_CENTROIDS = choose_initial_centroids(DATASET_X, n_clusters=8)


def plot_kmeans_convergence(
    data: np.ndarray,
    centroids: np.ndarray,
    iter_options: Sequence[int] = (1, 2, 5, 10, 50),
    random_state: int = 117_117,
) -> OrderedDict[int, float]:
    """รัน k-means ด้วย max_iter ต่างกันเพื่อดูการลู่เข้า"""
    japanize_matplotlib.japanize()
    fig, axes = plt.subplots(1, len(iter_options), figsize=(16, 3.5), sharex=True, sharey=True)
    inertia_by_iter: OrderedDict[int, float] = OrderedDict()

    for ax, max_iter in zip(axes, iter_options, strict=False):
        model = KMeans(
            n_clusters=len(centroids),
            init=centroids,
            n_init=1,
            max_iter=max_iter,
            random_state=random_state,
        ).fit(data)

        inertia_by_iter[max_iter] = float(model.inertia_)
        ax.scatter(data[:, 0], data[:, 1], c=model.labels_, cmap="tab20", s=6)
        ax.scatter(model.cluster_centers_[:, 0], model.cluster_centers_[:, 1], c="black", s=40, marker="x")
        ax.set_title(f"max_iter = {max_iter}")
        ax.grid(alpha=0.2)

    fig.suptitle("การลู่เข้าเมื่อเปลี่ยนจำนวนรอบ")
    fig.tight_layout()
    plt.show()
    return inertia_by_iter


CONVERGENCE_STATS = plot_kmeans_convergence(DATASET_X, INITIAL_CENTROIDS)
for iteration, inertia in CONVERGENCE_STATS.items():
    print(f"max_iter={iteration}: inertia={inertia:,.1f}")

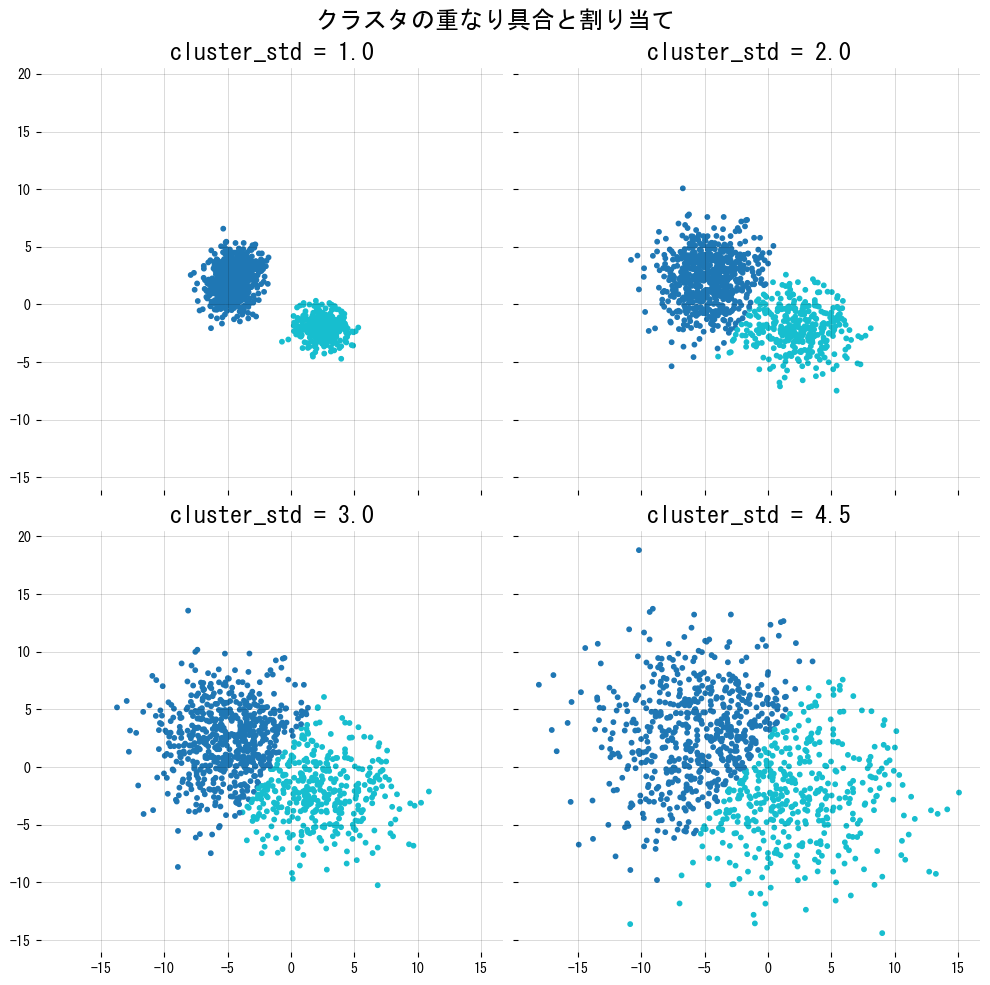
3. ดูผลเมื่อคลัสเตอร์เริ่มทับกัน #
def plot_cluster_overlap_effect(
    base_random_state: int = 117_117,
    cluster_stds: Sequence[float] = (1.0, 2.0, 3.0, 4.5),
) -> None:
    """แสดงให้เห็นว่าคลัสเตอร์ซ้อนกันทำให้การจัดกลุ่มยากขึ้นอย่างไร"""
    japanize_matplotlib.japanize()
    fig, axes = plt.subplots(2, 2, figsize=(10, 10), sharex=True, sharey=True)

    for ax, std in zip(axes.ravel(), cluster_stds, strict=False):
        features, _ = make_blobs(
            n_samples=1_000,
            random_state=base_random_state,
            cluster_std=std,
        )
        assignments = KMeans(n_clusters=2, random_state=base_random_state).fit_predict(features)
        ax.scatter(features[:, 0], features[:, 1], c=assignments, cmap="tab10", s=10)
        ax.set_title(f"cluster_std = {std}")
        ax.grid(alpha=0.2)

    fig.suptitle("ผลของการซ้อนทับระหว่างคลัสเตอร์")
    fig.tight_layout()
    plt.show()


plot_cluster_overlap_effect()

4. เปรียบเทียบเกณฑ์เลือก \(k\) #
from sklearn.metrics import silhouette_score


def analyse_cluster_counts(
    data: np.ndarray,
    k_range: Sequence[int] = range(2, 11),
) -> dict[str, list[float]]:
    """คำนวณ WCSS และ silhouette score หลายค่า k"""
    inertias: list[float] = []
    silhouettes: list[float] = []

    for k in k_range:
        model = KMeans(n_clusters=k, random_state=117_117).fit(data)
        inertias.append(float(model.inertia_))
        silhouettes.append(float(silhouette_score(data, model.labels_)))

    return {"inertia": inertias, "silhouette": silhouettes}


def plot_cluster_count_metrics(
    metrics: dict[str, list[float]],
    k_range: Sequence[int],
) -> None:
    """วาดกราฟ elbow และ silhouette"""
    japanize_matplotlib.japanize()
    ks = list(k_range)

    fig, axes = plt.subplots(1, 2, figsize=(12, 4))
    axes[0].plot(ks, metrics["inertia"], marker="o")
    axes[0].set_title("Elbow curve (WCSS)")
    axes[0].set_xlabel("k")
    axes[0].set_ylabel("WCSS")
    axes[0].grid(alpha=0.2)

    axes[1].plot(ks, metrics["silhouette"], marker="o", color="#ea580c")
    axes[1].set_title("Silhouette score")
    axes[1].set_xlabel("k")
    axes[1].set_ylabel("score")
    axes[1].grid(alpha=0.2)

    fig.tight_layout()
    plt.show()


ELBOW_METRICS = analyse_cluster_counts(DATASET_X, range(2, 11))
plot_cluster_count_metrics(ELBOW_METRICS, range(2, 11))

best_k = int(
    range(2, 11)[
        max(
            range(len(ELBOW_METRICS["silhouette"])),
            key=ELBOW_METRICS["silhouette"].__getitem__,
        )
    ]
)
print(f"k ที่ให้ silhouette สูงสุด: {best_k}")

เอกสารอ้างอิง #
- MacQueen, J. (1967). Some Methods for Classification and Analysis of Multivariate Observations. Proceedings of the Fifth Berkeley Symposium.
- Arthur, D., & Vassilvitskii, S. (2007). k-means++: The Advantages of Careful Seeding. ACM-SIAM SODA.
- scikit-learn developers. (2024). Clustering. https://scikit-learn.org/stable/modules/clustering.html