สรุป สรุปเป้าหมาย สมมติฐาน และเงื่อนไขที่เหมาะสมของวิธีนี้. ตรวจสอบว่ากฎการอัปเดตหรือเกณฑ์การแบ่งส่งผลต่อพฤติกรรมโมเดลอย่างไร. ใช้ตัวอย่างโค้ดเพื่อกำหนดแนวทางปรับพารามิเตอร์อย่างเป็นรูปธรรม. สัญชาตญาณ
# Stacking คือแนวคิดที่สร้างหลายโมเดล แล้วนำผลลัพธ์ของโมเดลเหล่านั้นไปเป็นอินพุตให้โมเดลอีกตัวหนึ่ง
ในหน้านี้เราจะทดลอง stacking และดูว่าโมเดลใดในชั้นแรกมีผลต่อการทำนายมากที่สุด
คำอธิบายโดยละเอียด
# 1
2
3
4
5
6
7
8
9
10
import matplotlib.pyplot as plt
from sklearn.datasets import make_classification
from sklearn.tree import DecisionTreeClassifier
from sklearn.ensemble import RandomForestClassifier
from sklearn.ensemble import StackingClassifier
from sklearn.model_selection import train_test_split
from sklearn.metrics import roc_auc_score
from sklearn.tree import export_graphviz
from subprocess import call
สร้างข้อมูลสำหรับการทดลอง
# 1
2
3
4
5
6
7
8
9
10
11
12
13
14
# Create data with 20 features
n_features = 20
X , y = make_classification (
n_samples = 2500 ,
n_features = n_features ,
n_informative = 10 ,
n_classes = 2 ,
n_redundant = 0 ,
n_clusters_per_class = 4 ,
random_state = 777 ,
)
X_train , X_test , y_train , y_test = train_test_split (
X , y , test_size = 0.33 , random_state = 777
)
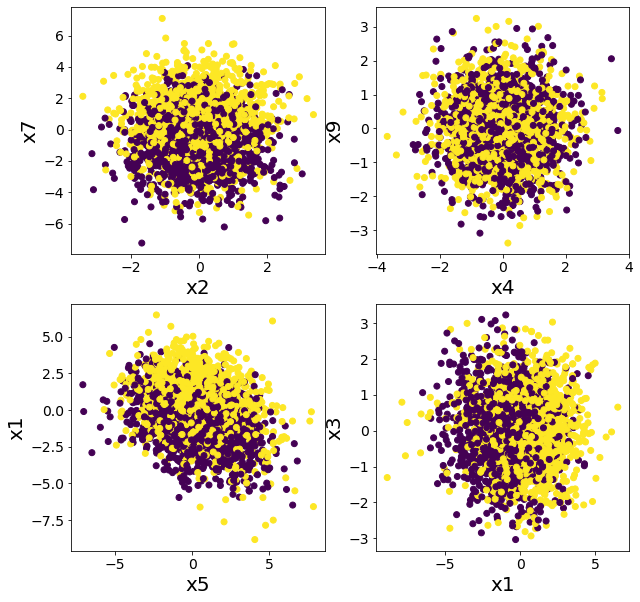
พล็อตข้อมูลหลายมุมมอง
# ยืนยันว่าข้อมูลไม่สามารถแบ่งด้วยกฎง่าย ๆ ได้ชัดเจน
 1
 2
 3
 4
 5
 6
 7
 8
 9
10
11
12
13
14
15
16
17
18
plt . figure ( figsize = ( 10 , 10 ))
plt . subplot ( 2 , 2 , 1 )
plt . scatter ( X [:, 2 ], X [:, 7 ], c = y )
plt . xlabel ( "x2" )
plt . ylabel ( "x7" )
plt . subplot ( 2 , 2 , 2 )
plt . scatter ( X [:, 4 ], X [:, 9 ], c = y )
plt . xlabel ( "x4" )
plt . ylabel ( "x9" )
plt . subplot ( 2 , 2 , 3 )
plt . scatter ( X [:, 5 ], X [:, 1 ], c = y )
plt . xlabel ( "x5" )
plt . ylabel ( "x1" )
plt . subplot ( 2 , 2 , 4 )
plt . scatter ( X [:, 1 ], X [:, 3 ], c = y )
plt . xlabel ( "x1" )
plt . ylabel ( "x3" )
plt . show ()
เปรียบเทียบ Stacking กับ Random Forest
# การจำแนกด้วย Random Forest
# 1
2
3
4
5
model = RandomForestClassifier ( n_estimators = 50 , max_depth = 5 , random_state = 777 )
model . fit ( X_train , y_train )
y_pred = model . predict ( X_test )
rf_score = roc_auc_score ( y_test , y_pred )
print ( f "ROC-AUC = { rf_score } " )
ROC-AUC = 0.855797033310609
Stacking ด้วยหลายต้นไม้
# ยืนยันว่า stacking ที่ใช้เฉพาะ DecisionTreeClassifier ยังไม่ช่วยให้ดีขึ้นมากนัก
 1
 2
 3
 4
 5
 6
 7
 8
 9
10
11
12
13
14
15
16
17
18
19
20
# Models used in base learner
estimators = [
( "dt1" , DecisionTreeClassifier ( max_depth = 3 , random_state = 777 )),
( "dt2" , DecisionTreeClassifier ( max_depth = 4 , random_state = 777 )),
( "dt3" , DecisionTreeClassifier ( max_depth = 5 , random_state = 777 )),
( "dt4" , DecisionTreeClassifier ( max_depth = 6 , random_state = 777 )),
]
# Number of models included in base learner
n_estimators = len ( estimators )
# aggregation model
final_estimator = DecisionTreeClassifier ( max_depth = 3 , random_state = 777 )
# train base-learner and aggregation model
clf = StackingClassifier ( estimators = estimators , final_estimator = final_estimator )
clf . fit ( X_train , y_train )
# evaluate
y_pred = clf . predict ( X_test )
clf_score = roc_auc_score ( y_test , y_pred )
print ( "ROC-AUC" )
print ( f "Decision Tree Stacking= { clf_score } , Random Forest= { rf_score } " )
ROC-AUC
Decision Tree Stacking=0.7359716965608031, Random Forest=0.855797033310609
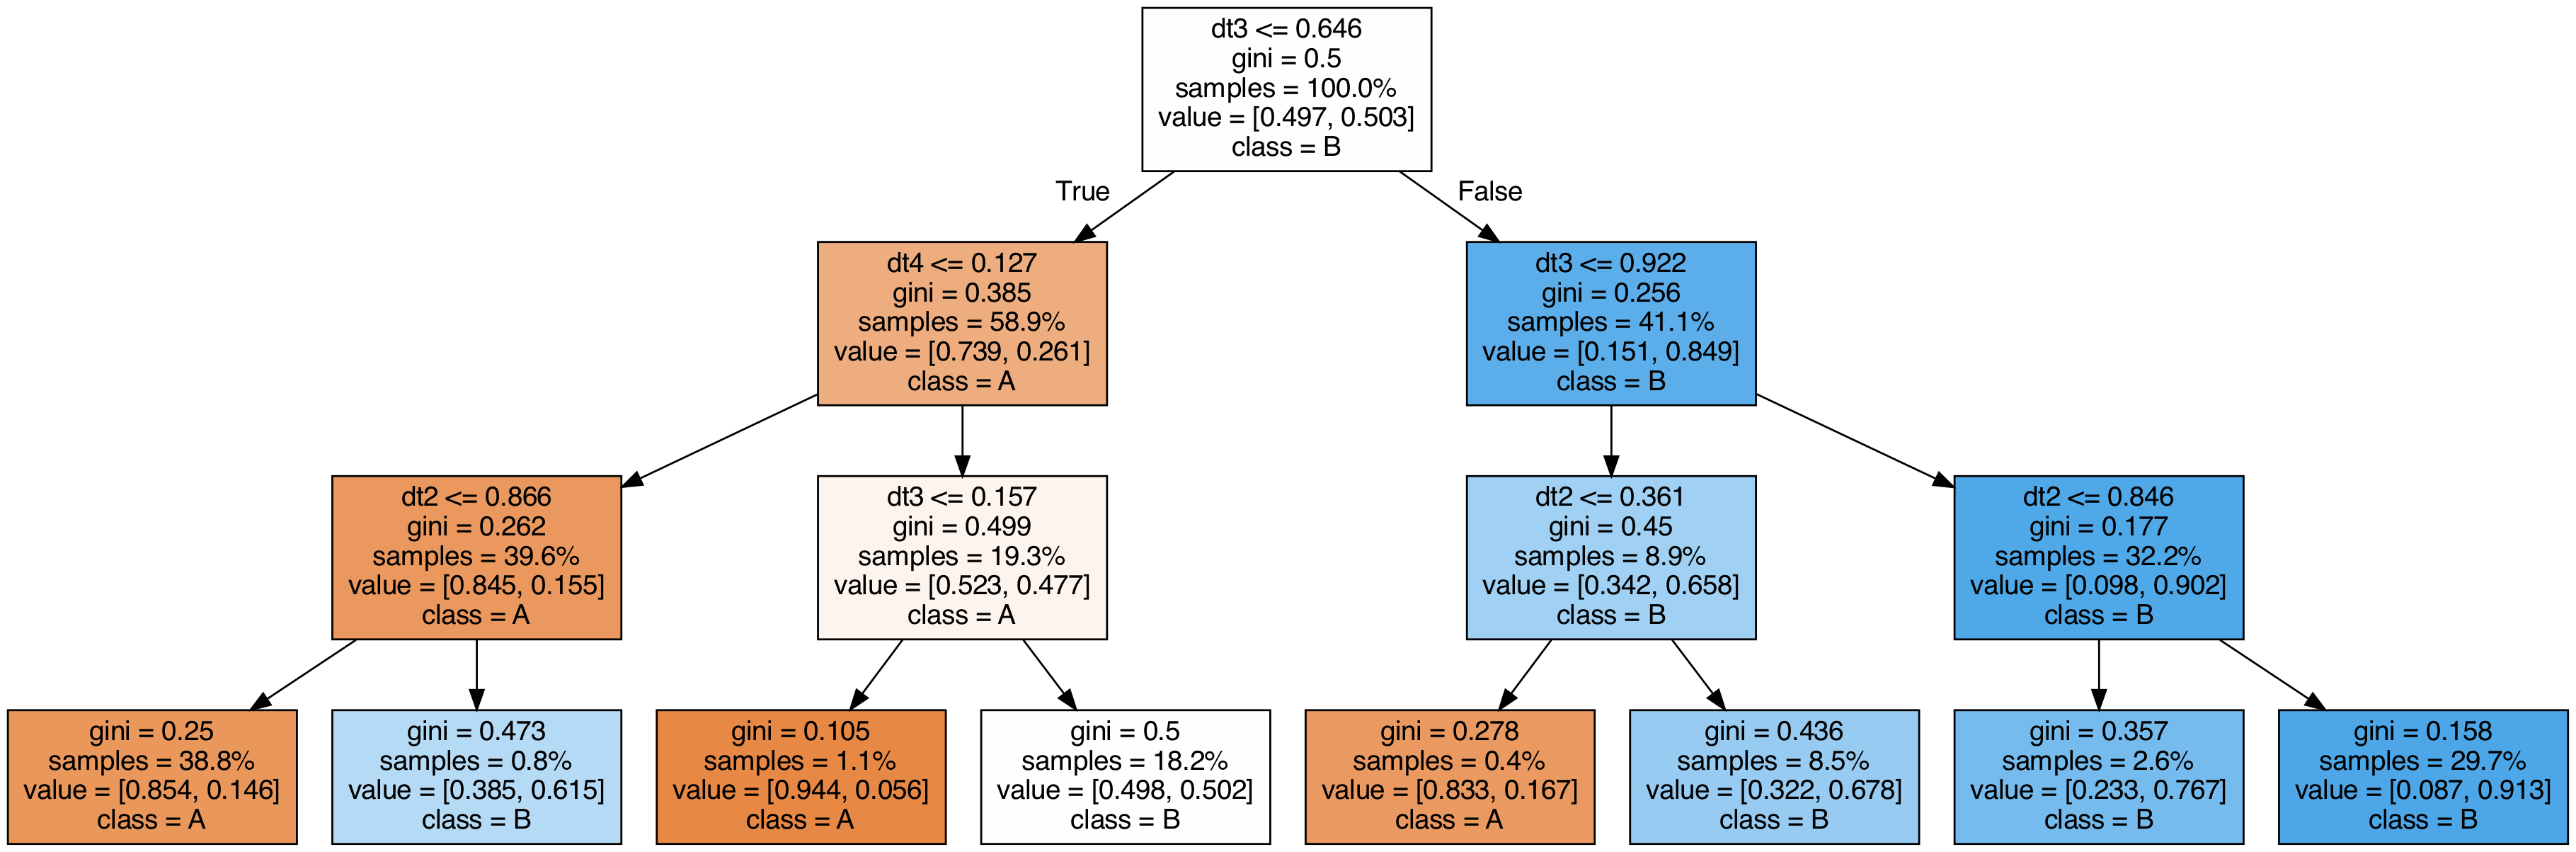
แสดงต้นไม้ที่ใช้ใน stacking
# 1
2
3
4
5
6
7
8
9
10
11
12
13
14
15
16
17
18
19
20
export_graphviz (
clf . final_estimator_ ,
out_file = "tree_final_estimator.dot" ,
class_names = [ "A" , "B" ],
feature_names = [ e [ 0 ] for e in estimators ],
proportion = True ,
filled = True ,
)
call (
[
"dot" ,
"-Tpng" ,
"tree_final_estimator.dot" ,
"-o" ,
f "tree_final_estimator.png" ,
"-Gdpi=200" ,
]
)
display ( Image ( filename = "tree_final_estimator.png" ))
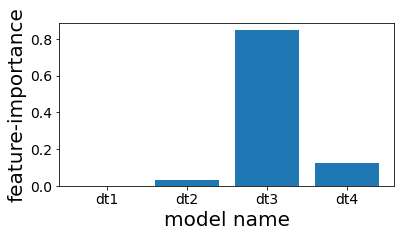
ดู feature importance ของต้นไม้ในชั้นบน
# จะเห็นว่าถึงจะ stacking หลายต้น แต่ท้ายที่สุดต้นไม้ตัวที่ 4 ถูกใช้แทบทั้งหมด
1
2
3
4
5
6
7
plt . figure ( figsize = ( 6 , 3 ))
plot_index = [ i for i in range ( n_estimators )]
plt . bar ( plot_index , clf . final_estimator_ . feature_importances_ )
plt . xticks ( plot_index , [ e [ 0 ] for e in estimators ])
plt . xlabel ( "model name" )
plt . ylabel ( "feature-importance" )
plt . show ()
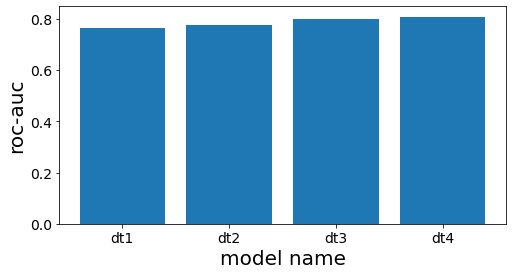
ตรวจสอบประสิทธิภาพของแต่ละต้นไม้ใน base learner
# 1
2
3
4
5
6
7
8
9
10
11
12
13
14
15
16
17
18
scores = []
for clf_estim in clf . estimators_ :
print ( "====" )
y_pred = clf_estim . predict ( X_test )
scr = roc_auc_score ( y_test , y_pred )
scores . append ( scr )
print ( clf_estim )
print ( scr )
n_estimators = len ( estimators )
plot_index = [ i for i in range ( n_estimators )]
plt . figure ( figsize = ( 8 , 4 ))
plt . bar ( plot_index , scores )
plt . xticks ( plot_index , [ e [ 0 ] for e in estimators ])
plt . xlabel ( "model name" )
plt . ylabel ( "roc-auc" )
plt . show ()
====
DecisionTreeClassifier(max_depth=3, random_state=777)
0.7660117774277722
====
DecisionTreeClassifier(max_depth=4, random_state=777)
0.7744128916993818
====
DecisionTreeClassifier(max_depth=5, random_state=777)
0.8000158677919086
====
DecisionTreeClassifier(max_depth=6, random_state=777)
0.8084639977432473