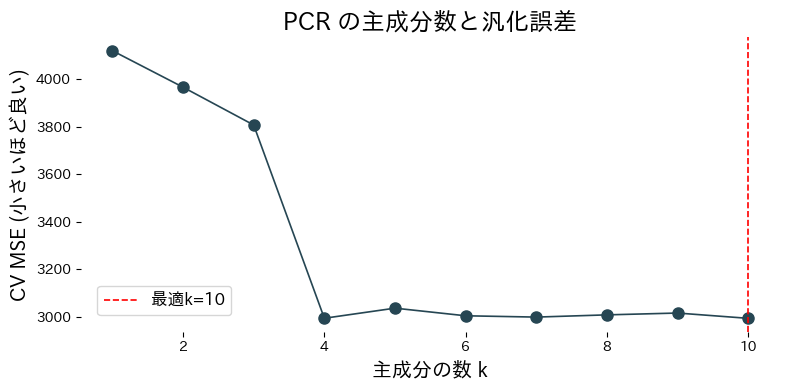
from__future__importannotationsimportjapanize_matplotlibimportmatplotlib.pyplotaspltimportnumpyasnpfromsklearn.datasetsimportload_diabetesfromsklearn.decompositionimportPCAfromsklearn.linear_modelimportLinearRegressionfromsklearn.model_selectionimportcross_val_scorefromsklearn.pipelineimportPipelinefromsklearn.preprocessingimportStandardScalerdefevaluate_pcr_components(cv_folds:int=5,xlabel:str="Number of components k",ylabel:str="CV MSE (lower is better)",title:str|None=None,label_best:str="best={k}",)->dict[str,float]:"""Cross-validate PCR with varying component counts and plot the curve.
Args:
cv_folds: Number of folds for cross-validation.
xlabel: Label for the component-count axis.
ylabel: Label for the error axis.
title: Optional title for the plot.
label_best: Format string for highlighting the best component count.
Returns:
Dictionary containing the best component count and its CV score.
"""japanize_matplotlib.japanize()X,y=load_diabetes(return_X_y=True)defbuild_pcr(n_components:int)->Pipeline:returnPipeline([("scale",StandardScaler()),("pca",PCA(n_components=n_components,random_state=0)),("reg",LinearRegression()),])components=np.arange(1,X.shape[1]+1)cv_scores=[]forkincomponents:model=build_pcr(int(k))score=cross_val_score(model,X,y,cv=cv_folds,scoring="neg_mean_squared_error",)cv_scores.append(score.mean())cv_scores_arr=np.array(cv_scores)best_idx=int(np.argmax(cv_scores_arr))best_k=int(components[best_idx])best_mse=float(-cv_scores_arr[best_idx])best_model=build_pcr(best_k).fit(X,y)explained=best_model["pca"].explained_variance_ratio_fig,ax=plt.subplots(figsize=(8,4))ax.plot(components,-cv_scores_arr,marker="o")ax.axvline(best_k,color="red",linestyle="--",label=label_best.format(k=best_k))ax.set_xlabel(xlabel)ax.set_ylabel(ylabel)iftitle:ax.set_title(title)ax.legend()fig.tight_layout()plt.show()return{"best_k":best_k,"best_mse":best_mse,"explained_variance_ratio":explained,}metrics=evaluate_pcr_components(xlabel="จำนวนองค์ประกอบ k",ylabel="CV MSE (ยิ่งต่ำยิ่งดี)",title="ผลของจำนวนองค์ประกอบใน PCR",label_best="k ที่ดีที่สุด = {k}",)print(f"จำนวนองค์ประกอบที่เหมาะสม: {metrics['best_k']}")print(f"ค่า CV MSE ที่ดีที่สุด: {metrics['best_mse']:.3f}")print("สัดส่วนความแปรปรวนที่อธิบายได้:",metrics["explained_variance_ratio"])
Jolliffe, I. T. (2002). Principal Component Analysis (2nd ed.). Springer.
Massy, W. F. (1965). Principal Components Regression in Exploratory Statistical Research. Journal of the American Statistical Association, 60(309), 234 E56.