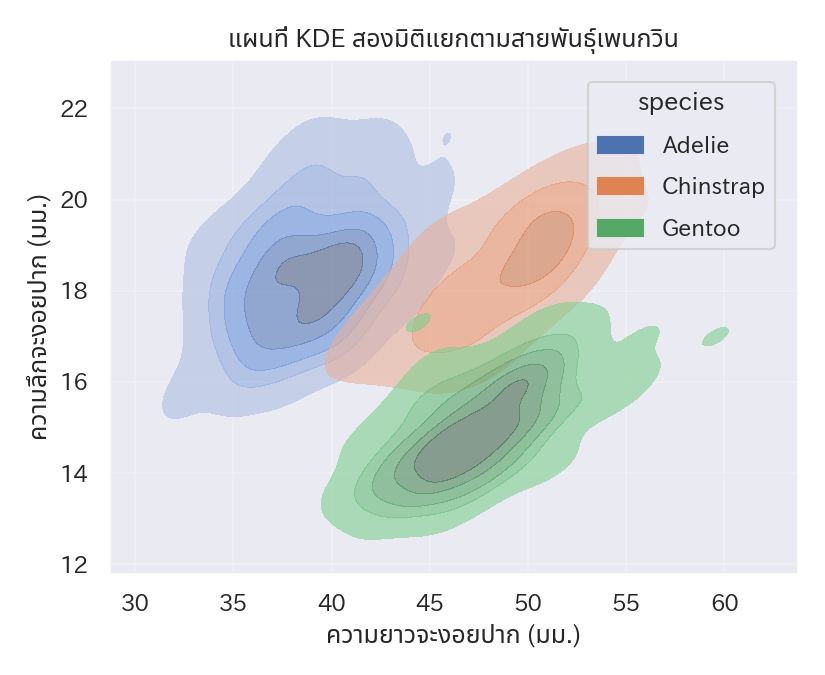
importseabornassnsimportmatplotlib.pyplotaspltpenguins=sns.load_dataset("penguins").dropna(subset=["bill_length_mm","bill_depth_mm"])fig,ax=plt.subplots(figsize=(5.5,4.5))sns.kdeplot(data=penguins,x="bill_length_mm",y="bill_depth_mm",hue="species",fill=True,thresh=0.05,levels=6,alpha=0.6,ax=ax,)ax.set_xlabel("ความยาวจะงอยปาก (มม.)")ax.set_ylabel("ความลึกจะงอยปาก (มม.)")ax.set_title("แผนที่ KDE สองมิติแยกตามสายพันธุ์เพนกวิน")ax.grid(alpha=0.2)fig.tight_layout()plt.show()