6.2.10
Rugplot เป็นเส้นบอกตำแหน่งข้อมูล
เมื่อนำ rugplot ซ้อนบนฮิสโตแกรมหรือ KDE จะเห็นตำแหน่งของแต่ละจุดข้อมูลชัดขึ้นว่ามากระจุกตรงไหน
 1
 2
 3
 4
 5
 6
 7
 8
 9
10
11
12
13
14
15
16
17
| import seaborn as sns
import matplotlib.pyplot as plt
diamonds = sns.load_dataset("diamonds").sample(300, random_state=0)
fig, ax = plt.subplots(figsize=(6, 3.5))
sns.kdeplot(data=diamonds, x="price", ax=ax, color="#0ea5e9")
sns.rugplot(data=diamonds, x="price", ax=ax, color="#1d4ed8", alpha=0.4)
ax.set_xlabel("ราคา ($)")
ax.set_ylabel("ความหนาแน่น")
ax.set_title("KDE + Rugplot ของราคาพลอย")
ax.grid(alpha=0.2)
fig.tight_layout()
plt.show()
|
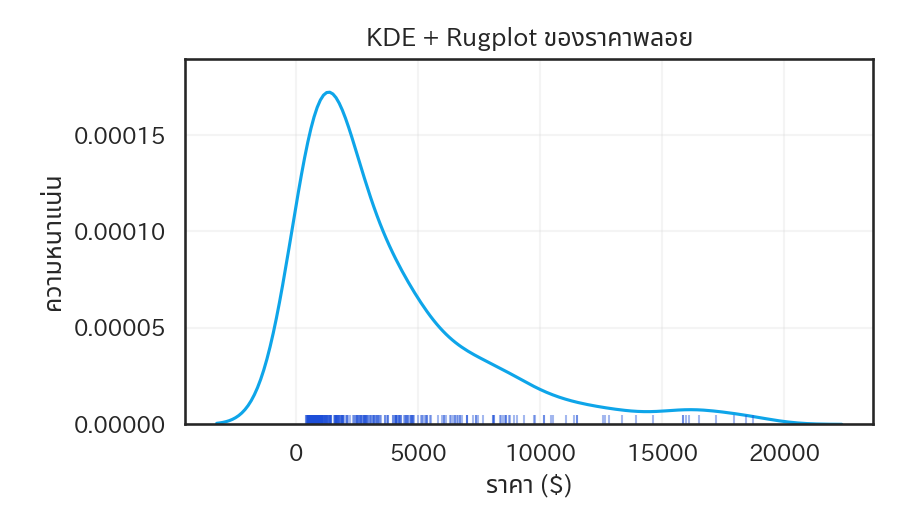
วิธีอ่าน
#
- เส้นสั้นๆ ของ rugplot ที่เรียงถี่แสดงว่ามีจุดข้อมูลมากในช่วงนั้น
- ใช้สีอ่อนเพื่อไม่ให้แย่งความสนใจจากเส้น KDE ที่เป็นกราฟหลัก
- ถ้าจำนวนจุดเยอะมาก อาจต้องสุ่มมาบางส่วนหรือปรับ
height ให้บางลงเพื่อลดภาระการเรนเดอร์