まとめ- MA(移動平均)過程は、過去の誤差項の線形結合で現在の値を表す確率過程。
- MA(1)・MA(2)・MA(5)のシミュレーションで、次数による系列の違いを確認する。
- ACFの形状からMA次数を推定する手がかりを学ぶ。
1. ライブラリ
#
1
2
3
| import statsmodels.api as sm
import numpy as np
import matplotlib.pyplot as plt
|
MA過程のデータを生成する
#
データを生成するための関数を用意します
 1
 2
 3
 4
 5
 6
 7
 8
 9
10
11
12
13
| def create_MAdata(thetas=[0.1], mu=1, N=400, init=1, c=1, sigma=0.3):
"""MAモデルで時系列データを生成"""
print(f"==MA({len(thetas)})過程の長さ{N}のデータを作成==")
epsilon = np.random.normal(loc=0, scale=sigma, size=N)
data = np.zeros(N)
data[0] = init
for t in range(2, N):
res = mu + epsilon[t]
for j, theta_j in enumerate(thetas):
res += theta_j * epsilon[t - j - 1]
data[t] = res
return data
|
MA(1)
#
1
2
3
4
5
6
| plt.figure(figsize=(12, 6))
thetas = [0.5]
ma1_1 = create_MAdata(thetas=thetas)
plt.title(f"MA{len(thetas)}過程", fontsize=15)
plt.plot(ma1_1)
plt.show()
|
==MA(1)過程の長さ400のデータを作成==

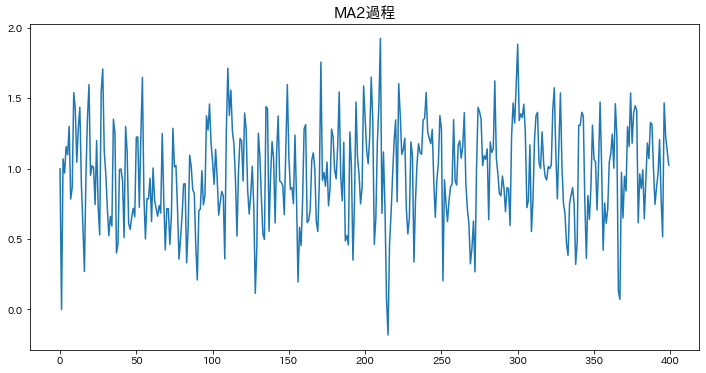
MA(2)
#
1
2
3
4
5
6
| plt.figure(figsize=(12, 6))
thetas = [0.5, 0.5]
ma1_2 = create_MAdata(thetas=thetas)
plt.title(f"MA{len(thetas)}過程", fontsize=15)
plt.plot(ma1_1)
plt.show()
|
==MA(2)過程の長さ400のデータを作成==
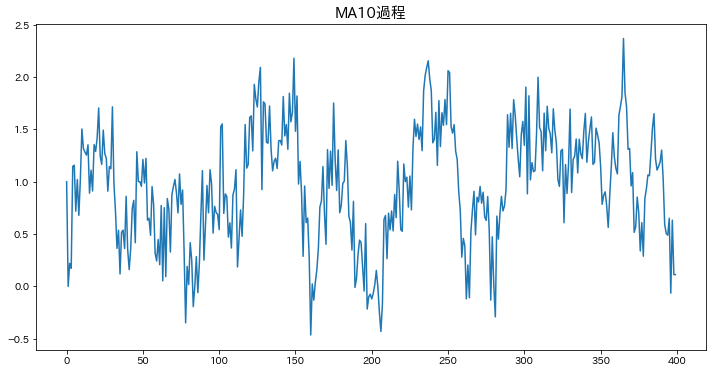
MA(5)
#
1
2
3
4
5
6
| plt.figure(figsize=(12, 6))
thetas = [0.5 for _ in range(10)]
ma1_5 = create_MAdata(thetas=thetas)
plt.title(f"MA{len(thetas)}過程", fontsize=15)
plt.plot(ma1_5)
plt.show()
|
==MA(10)過程の長さ400のデータを作成==