 1
 2
 3
 4
 5
 6
 7
 8
 9
10
11
12
13
14
15
16
17
18
19
20
21
22
23
24
25
26
27
28
29
30
31
32
33
34
35
36
37
38
39
40
41
42
43
44
45
46
47
48
49
50
51
52
53
54
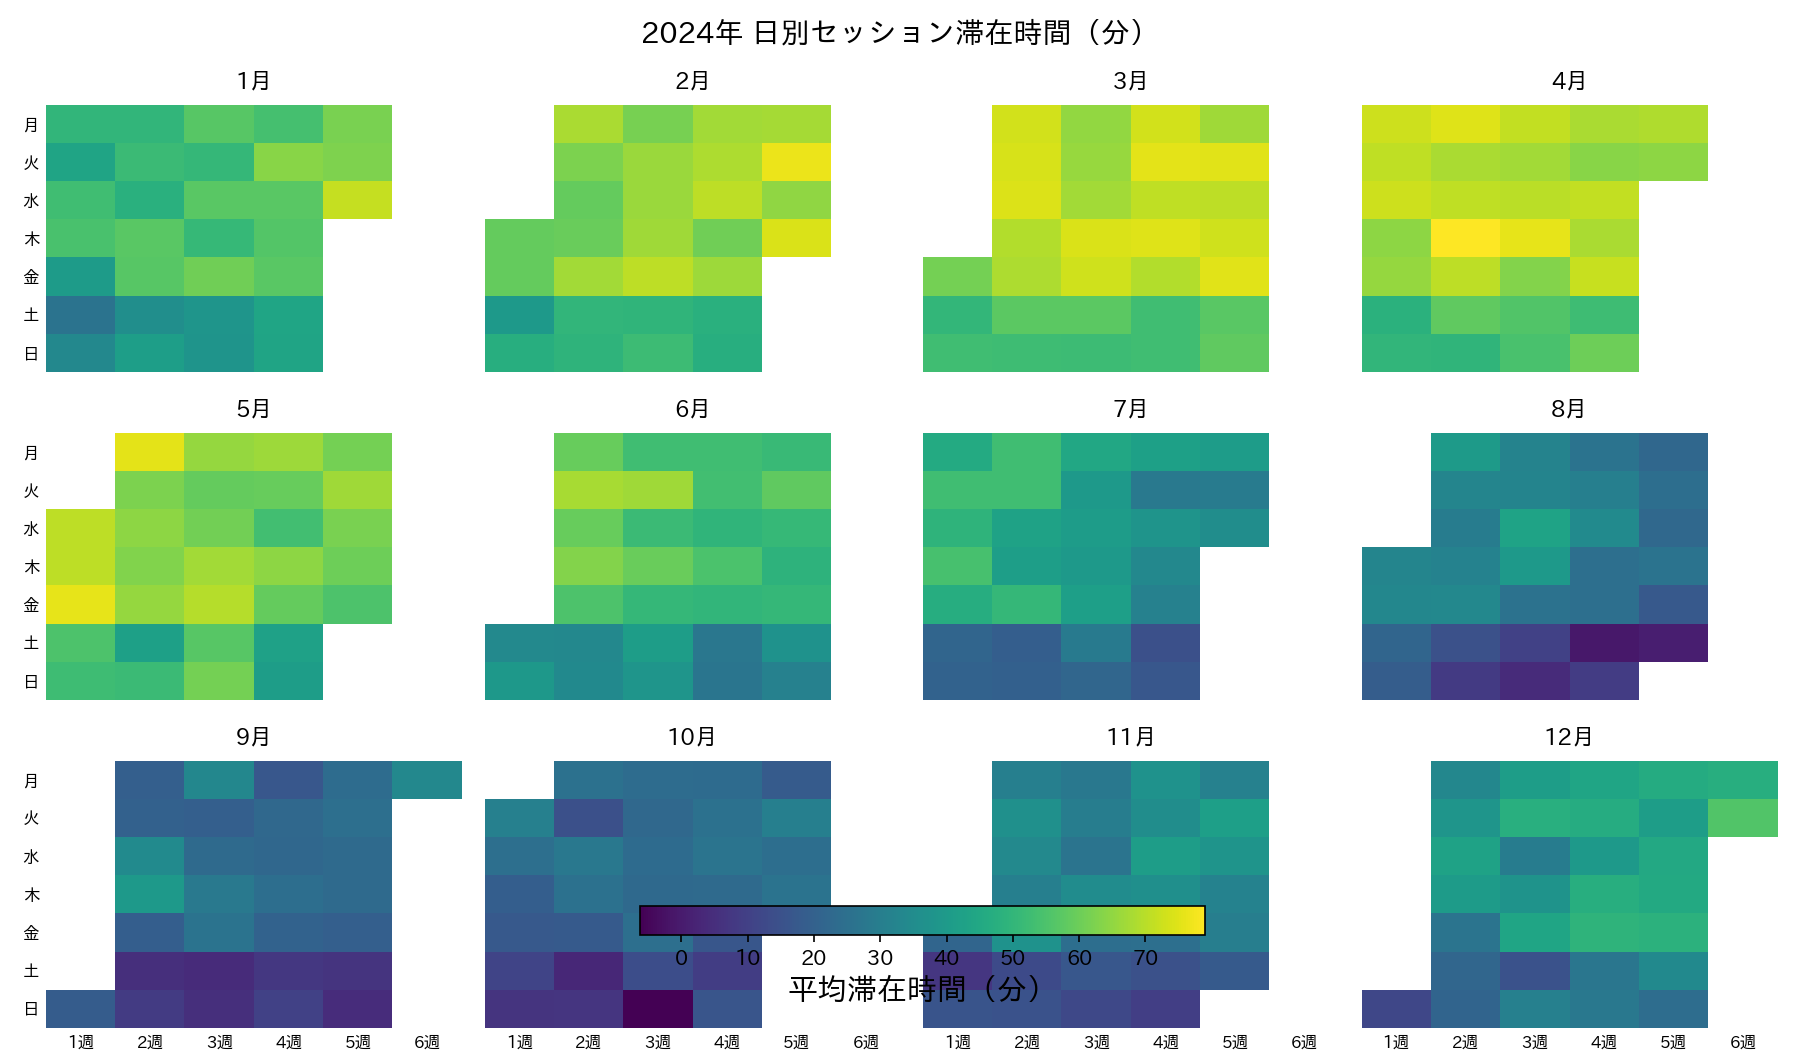
| import numpy as np
import pandas as pd
import matplotlib.pyplot as plt
date_index = pd.date_range("2024-01-01", "2024-12-31", freq="D")
# 季節要因 + 曜日要因 + ノイズを混ぜた架空メトリクス
seasonal = 40 + 25 * np.sin(2 * np.pi * date_index.dayofyear / 365)
weekday_boost = np.where(date_index.weekday < 5, 8, -10)
rng = np.random.default_rng(42)
metric = seasonal + weekday_boost + rng.normal(0, 5, len(date_index))
calendar_df = pd.DataFrame({"date": date_index, "value": metric})
calendar_df["month"] = calendar_df["date"].dt.month
calendar_df["weekday"] = calendar_df["date"].dt.weekday
month_start_weekday = (
calendar_df["date"].dt.to_period("M").dt.to_timestamp().dt.weekday
)
calendar_df["week_of_month"] = (
(month_start_weekday + calendar_df["date"].dt.day - 1) // 7
).astype(int)
fig, axes = plt.subplots(3, 4, figsize=(12, 7), sharex=True, sharey=True)
vmin, vmax = calendar_df["value"].min(), calendar_df["value"].max()
for month in range(1, 13):
ax = axes[(month - 1) // 4, (month - 1) % 4]
month_df = calendar_df[calendar_df["month"] == month]
matrix = np.full((7, 6), np.nan)
for row in month_df.itertuples():
matrix[row.weekday, row.week_of_month] = row.value
im = ax.imshow(
matrix,
origin="upper",
aspect="auto",
cmap="viridis",
vmin=vmin,
vmax=vmax,
)
ax.set_title(f"{month}月", fontsize=11, pad=8)
ax.set_xticks(range(6), labels=["1週", "2週", "3週", "4週", "5週", "6週"], fontsize=8)
ax.set_yticks(range(7), labels=["月", "火", "水", "木", "金", "土", "日"], fontsize=8)
ax.tick_params(length=0)
fig.suptitle("2024年 日別セッション滞在時間(分)", fontsize=14, y=0.98)
cbar = fig.colorbar(im, ax=axes, orientation="horizontal", fraction=0.035, pad=0.08)
cbar.set_label("平均滞在時間(分)")
fig.tight_layout()
plt.show()
|