6.5.1
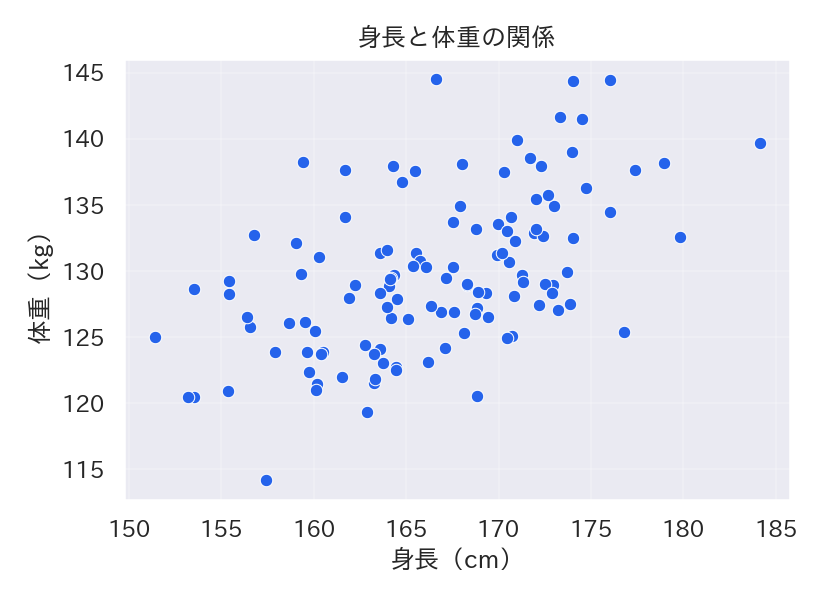
散布図の基本形
まとめ
- 2変数の関係を点の位置で確認する基本的な散布図。
sns.scatterplotでデータの相関や外れ値を可視化する。- 変数間の関連性をざっくり把握したい初期段階で使う。
身長と体重の関係をランダムデータで描いた基本的な散布図です。seaborn.scatterplot を使うとスタイルを統一できます。
| |
読み方のポイント #
- 相関が強いほど点が細い帯状にまとまる。相関が弱いと円形に散らばる。
- 点が重なりすぎる場合はアルファ値(
alpha)を下げる、もしくは Hexbin など別手法を検討する。 - 外れ値を見つけたら、別途明示して原因分析につなげる。
いつ使うか #
- 適している場面: 2つの連続変数の関係を素早く概観したいとき。外れ値や非線形な傾向の発見に適しています。
- 不向きな場面: データ点が多すぎる(1万点超)場合は重なりが激しくなり、hexbin や kde-2d の方が適切です。
- 代替手段: バブルチャートを使えば第3変数もサイズで同時に表現できます。
よくある失敗パターン #
- 過密プロット: 数千点以上を同じ透過率で描画するとすべて塗りつぶし状態になります。alpha を 0.1〜0.3 に下げるか hexbin を検討してください。
- 軸スケールの不一致: X 軸と Y 軸のスケールが大きく異なると相関の視覚的印象が歪みます。必要に応じて正規化を検討しましょう。
- 回帰直線を重ねた散布図 — 線形トレンドを回帰線で確認
- バブルチャート — 点のサイズで第三変数を表現
- 相関ヒートマップ — 変数間の相関を色で一覧