tsfresh
時系列データを扱うとき、タイムスタンプと数値の列をもとに様々な特徴量を計算することがあります。このページではtsfreshを用いて時系列データから特徴量を計算してみます。また、動画ではどのような観点で特徴量を作ることができるか説明します。
tsfresh
Overview on extracted featuresを参考に、どんな特徴量が作成されるか確認してみます。
import os
import numpy as np
import pandas as pd
import matplotlib.pyplot as plt
from tsfresh import extract_features

X = []
for id, it in enumerate(np.linspace(0.1, 100, 100)):
    for jt in range(10):
        X.append(
            [
                id,
                jt,
                jt + np.sin(it),
                jt % 2 + np.cos(it),
                jt % 3 + np.tan(it),
                np.log(it + jt),
            ]
        )

X = pd.DataFrame(X)
X.columns = ["id", "time", "fx1", "fx2", "fx3", "fx4"]
X.head()
| id | time | fx1 | fx2 | fx3 | fx4 | |
|---|---|---|---|---|---|---|
| 0 | 0 | 0 | 0.099833 | 0.995004 | 0.100335 | -2.302585 |
| 1 | 0 | 1 | 1.099833 | 1.995004 | 1.100335 | 0.095310 |
| 2 | 0 | 2 | 2.099833 | 0.995004 | 2.100335 | 0.741937 |
| 3 | 0 | 3 | 3.099833 | 1.995004 | 0.100335 | 1.131402 |
| 4 | 0 | 4 | 4.099833 | 0.995004 | 1.100335 | 1.410987 |
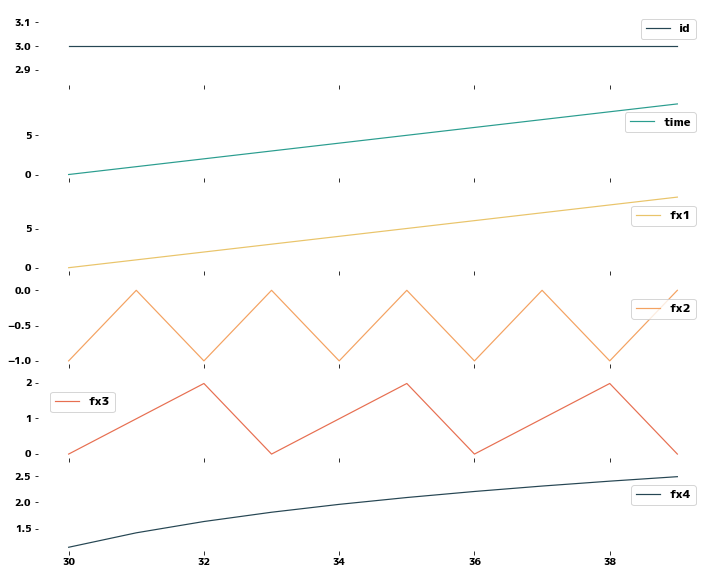
X[X["id"] == 3].plot(subplots=True, sharex=True, figsize=(12, 10))
plt.show()
特徴量を計算する
extract_featuresを使って、一気にすべての特徴量を計算することができます。また、tsfresh.feature_selection以下の関数を用いることで特徴選択を実行することもできます。
extracted_features = extract_features(X, column_id="id", column_sort="time")
extracted_features.head()
Feature Extraction: 100%|█
| fx1__variance_larger_than_standard_deviation | fx1__has_duplicate_max | fx1__has_duplicate_min | fx1__has_duplicate | fx1__sum_values | fx1__abs_energy | fx1__mean_abs_change | fx1__mean_change | fx1__mean_second_derivative_central | fx1__median | ... | fx4__permutation_entropy__dimension_6__tau_1 | fx4__permutation_entropy__dimension_7__tau_1 | fx4__query_similarity_count__query_None__threshold_0.0 | fx4__matrix_profile__feature_"min"__threshold_0.98 | fx4__matrix_profile__feature_"max"__threshold_0.98 | fx4__matrix_profile__feature_"mean"__threshold_0.98 | fx4__matrix_profile__feature_"median"__threshold_0.98 | fx4__matrix_profile__feature_"25"__threshold_0.98 | fx4__matrix_profile__feature_"75"__threshold_0.98 | fx4__mean_n_absolute_max__number_of_maxima_7 | |
|---|---|---|---|---|---|---|---|---|---|---|---|---|---|---|---|---|---|---|---|---|---|
| 0 | 1.0 | 0.0 | 0.0 | 0.0 | 45.998334 | 294.084675 | 1.0 | 1.0 | -3.469447e-18 | 4.599833 | ... | -0.0 | -0.0 | NaN | NaN | NaN | NaN | NaN | NaN | NaN | 1.915905 |
| 1 | 1.0 | 0.0 | 0.0 | 0.0 | 53.952941 | 373.591982 | 1.0 | 1.0 | -6.938894e-18 | 5.395294 | ... | -0.0 | -0.0 | NaN | NaN | NaN | NaN | NaN | NaN | NaN | 1.918724 |
| 2 | 1.0 | 0.0 | 0.0 | 0.0 | 53.538882 | 369.141186 | 1.0 | 1.0 | 0.000000e+00 | 5.353888 | ... | -0.0 | -0.0 | NaN | NaN | NaN | NaN | NaN | NaN | NaN | 2.062001 |
| 3 | 1.0 | 0.0 | 0.0 | 0.0 | 45.143194 | 286.290800 | 1.0 | 1.0 | -8.673617e-19 | 4.514319 | ... | -0.0 | -0.0 | NaN | NaN | NaN | NaN | NaN | NaN | NaN | 2.186180 |
| 4 | 1.0 | 0.0 | 0.0 | 0.0 | 36.613658 | 216.555992 | 1.0 | 1.0 | 0.000000e+00 | 3.661366 | ... | -0.0 | -0.0 | NaN | NaN | NaN | NaN | NaN | NaN | NaN | 2.295964 |
5 rows × 3156 columns
